Fig. 4
Download original image
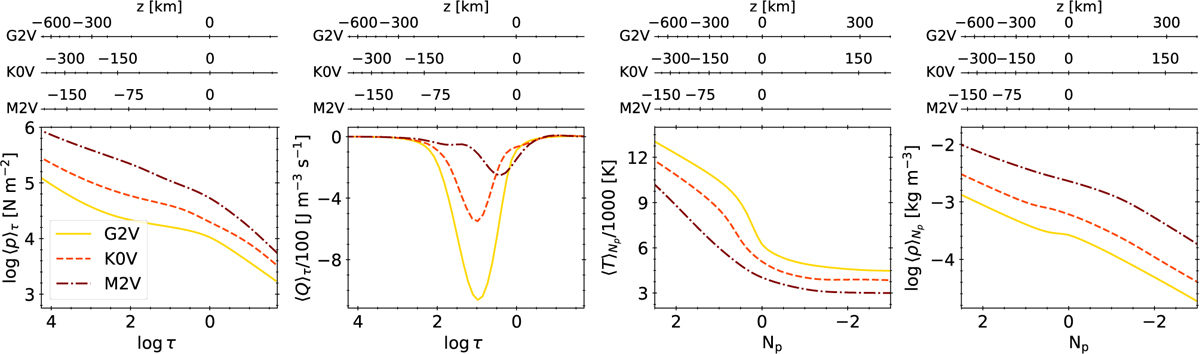
Logarithm of the pressure (left panel), radiative energy exchange rate (second), temperature (third), and logarithm of the density (right) averaged over time and Rosseland iso-τ surfaces (two left panels) or surfaces of a constant number of pressure scale heights (two right panels). The colours and line styles have the same meaning as in Fig. 1. Three top axes of each column: geometrical height for the three stars.
Current usage metrics show cumulative count of Article Views (full-text article views including HTML views, PDF and ePub downloads, according to the available data) and Abstracts Views on Vision4Press platform.
Data correspond to usage on the plateform after 2015. The current usage metrics is available 48-96 hours after online publication and is updated daily on week days.
Initial download of the metrics may take a while.