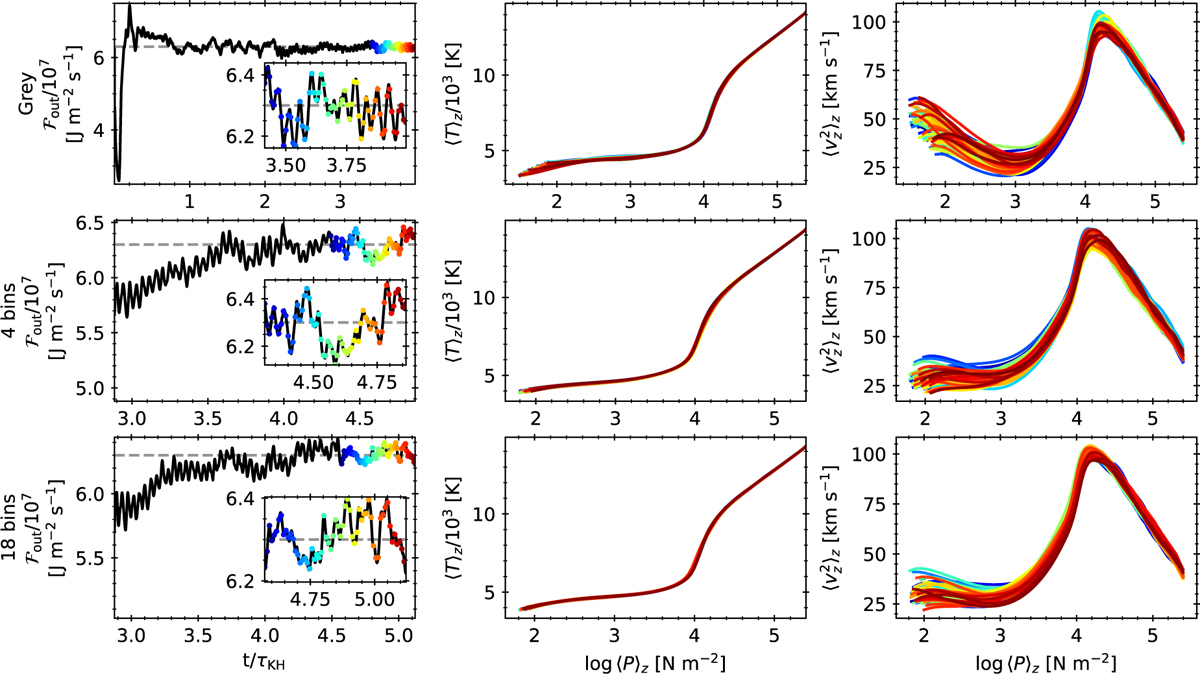
Fig. B.1
Download original image
Emergent stellar flux (left column), mean stratification of temperature (middle), and RMS vertical velocity (right) averaged over planes of constant geometrical height for the simulations of the G2V star. Left column: the horizontal dashed grey line shows the targeted stellar flux (effective temperature, see Table 1). The horizontal axis shows the ratio of the time and the Kelvin-Helmholtz time scale. The coloured dots sample 50 snapshots of the time-series used in the results in the present paper. The corresponding embedded panels show the flux evolution for this time-series. Middle column: the temperature versus the logarithm pressure is shown at different times (with the same colours as the dots in the panels at the left column). Right column: the RMS vertical velocity versus the logarithm pressure is shown at different times (with the same colours as the dots in the panels at the left column). The top row corresponds to the simulation computed with grey opacity; the middle row, with 4OB; and the bottom row, with 18OB.
Current usage metrics show cumulative count of Article Views (full-text article views including HTML views, PDF and ePub downloads, according to the available data) and Abstracts Views on Vision4Press platform.
Data correspond to usage on the plateform after 2015. The current usage metrics is available 48-96 hours after online publication and is updated daily on week days.
Initial download of the metrics may take a while.