Open Access
Fig. 10
Download original image
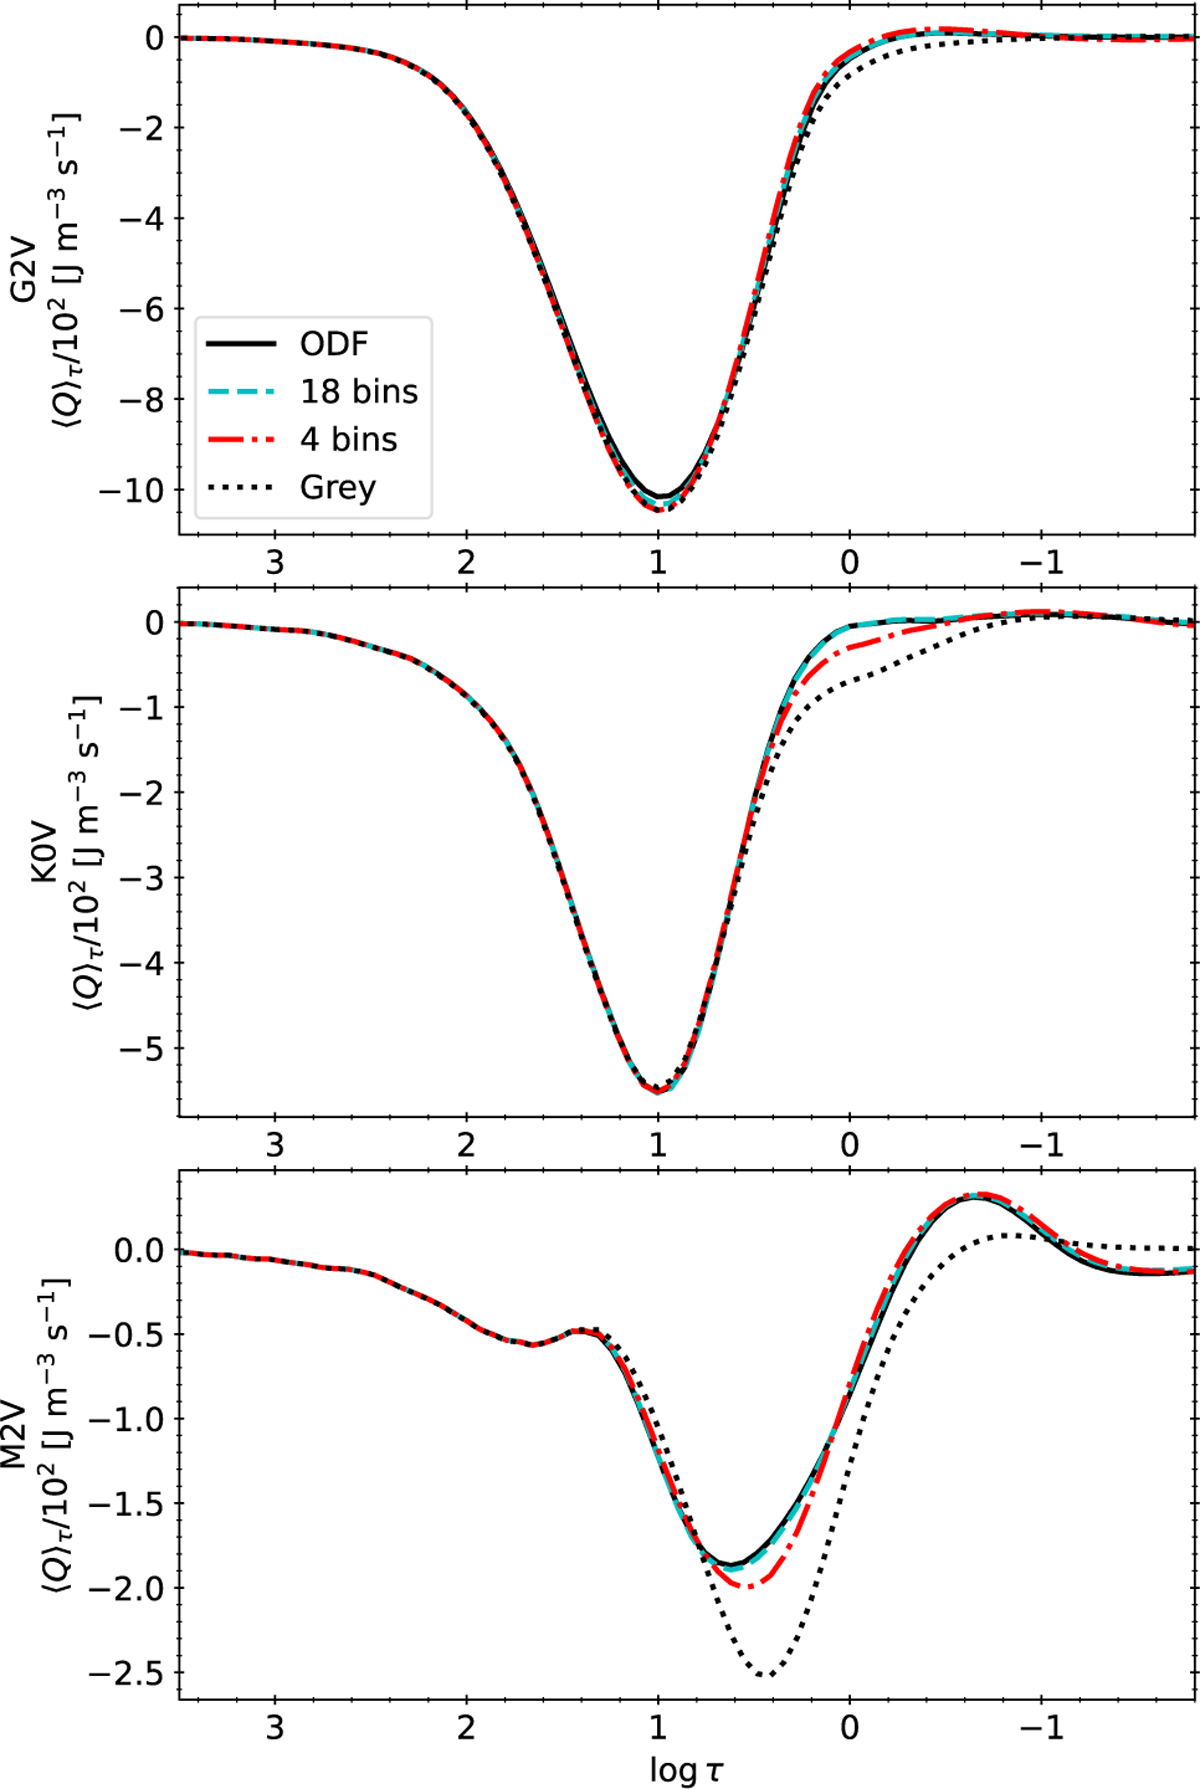
Radiative energy exchange rates Q averaged over Rosseland iso-τ surfaces and computed using the ODF (solid black curve), the opacity labelled as 18OB (dash blue curve), 4OB (dash-dotted red curve), and grey (dotted black curve), for the G2V (top column), K0V (middle), and M2V star (bottom).
Current usage metrics show cumulative count of Article Views (full-text article views including HTML views, PDF and ePub downloads, according to the available data) and Abstracts Views on Vision4Press platform.
Data correspond to usage on the plateform after 2015. The current usage metrics is available 48-96 hours after online publication and is updated daily on week days.
Initial download of the metrics may take a while.