Fig. 1
Download original image
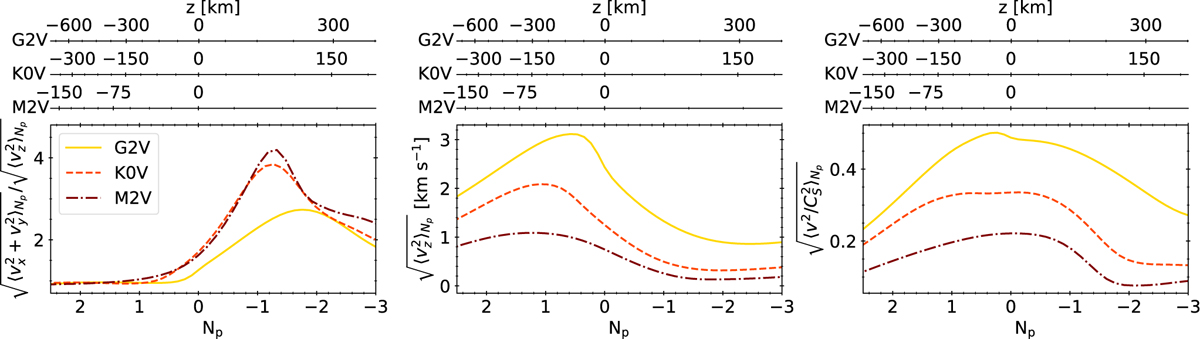
Mean properties of the velocity fields of the three stellar simulations (G2V is the solid yellow line, K0V is the dashed orange line, and M2V is the dot-dashed brown line) averaged over time and surfaces of constant number of pressure scale heights Np (Eq. (5)) versus Np. Left panel: ratio of RMS horizontal and RMS vertical velocities. Middle panel: RMS vertical velocity. Right panel: Mach number. Three top axes on each column: geometrical height for the three stars.
Current usage metrics show cumulative count of Article Views (full-text article views including HTML views, PDF and ePub downloads, according to the available data) and Abstracts Views on Vision4Press platform.
Data correspond to usage on the plateform after 2015. The current usage metrics is available 48-96 hours after online publication and is updated daily on week days.
Initial download of the metrics may take a while.