Fig. 8
Download original image
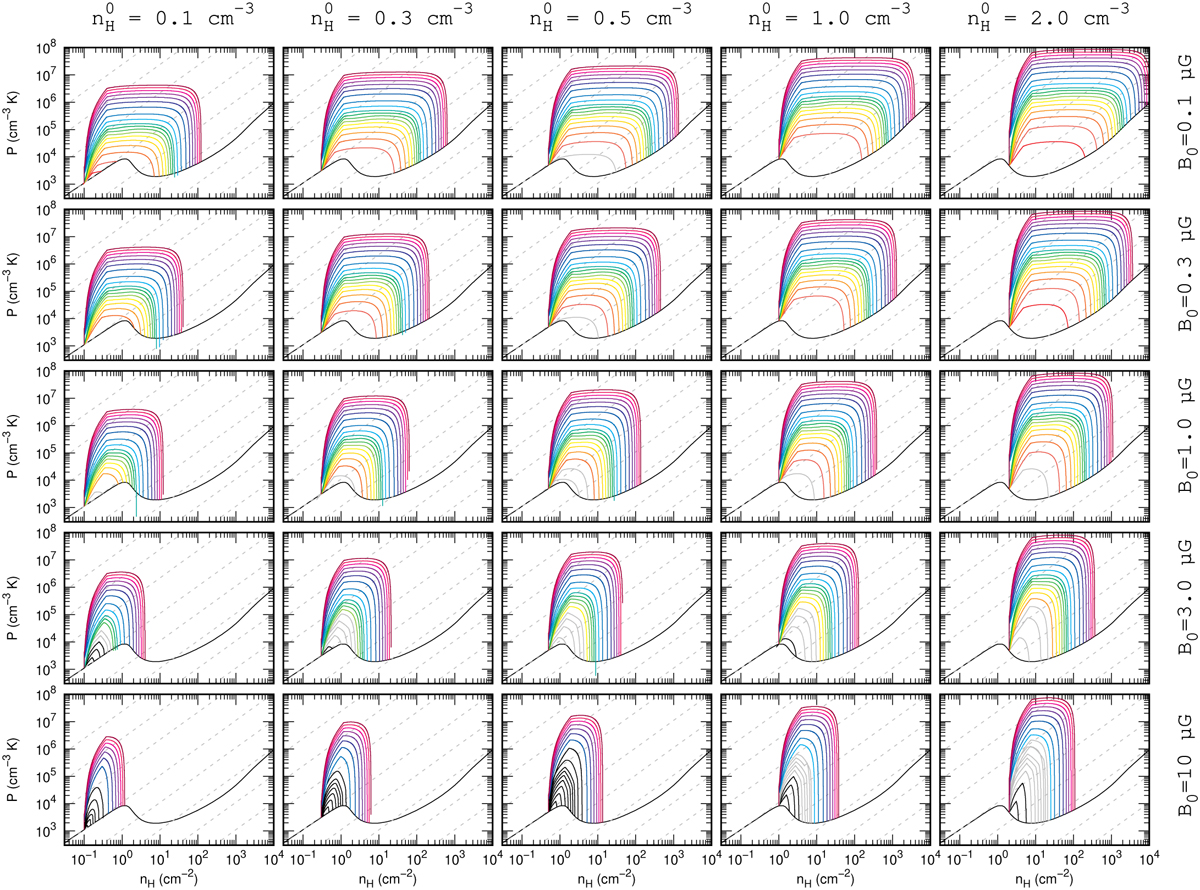
Trajectories followed by interstellar shocks in a proton density versus thermal pressure diagram (see Fig. 5). Each panel corresponds to different values of the initial density ![]() (top labels) and transverse magnetic field B0 (right labels). The different curves correspond to the following values of the shock velocity ordered from top to bottom trajectories: 500, 450, 400, 350, 300, 250, 200, 150, 120, 100, 90, 80, 70, 60, 50, 40, 30, 20, and 10 km s−1. Colored trajectories correspond to J-type shocks, gray trajectories to CJ-type shocks, and black trajectories to C-type shocks. The black curve common to all panels indicates the thermal equilibrium state of the diffuse gas as a function of the proton density obtained for G0 = 1 (see Fig. 1). Light gray lines are isothermal contours from 1 to 107 K (from bottom right to top left). We note that the trajectories of low-velocity shocks are not always visible as they only slightly perturb the gas from its original state.
(top labels) and transverse magnetic field B0 (right labels). The different curves correspond to the following values of the shock velocity ordered from top to bottom trajectories: 500, 450, 400, 350, 300, 250, 200, 150, 120, 100, 90, 80, 70, 60, 50, 40, 30, 20, and 10 km s−1. Colored trajectories correspond to J-type shocks, gray trajectories to CJ-type shocks, and black trajectories to C-type shocks. The black curve common to all panels indicates the thermal equilibrium state of the diffuse gas as a function of the proton density obtained for G0 = 1 (see Fig. 1). Light gray lines are isothermal contours from 1 to 107 K (from bottom right to top left). We note that the trajectories of low-velocity shocks are not always visible as they only slightly perturb the gas from its original state.
Current usage metrics show cumulative count of Article Views (full-text article views including HTML views, PDF and ePub downloads, according to the available data) and Abstracts Views on Vision4Press platform.
Data correspond to usage on the plateform after 2015. The current usage metrics is available 48-96 hours after online publication and is updated daily on week days.
Initial download of the metrics may take a while.