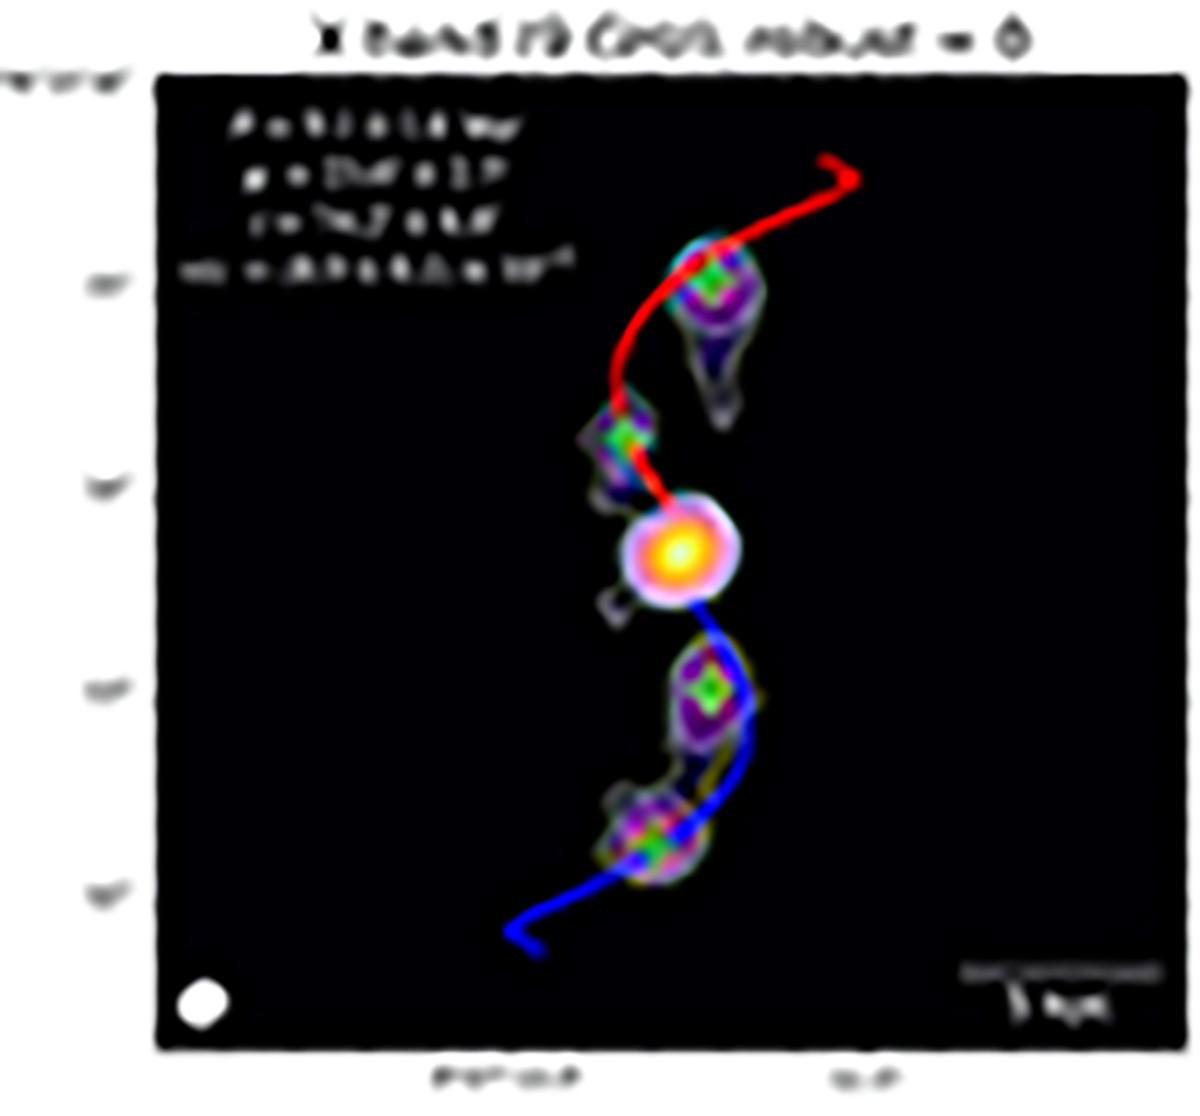
Fig. 8.
Download original image
Jet precession in RBS 797. Precession model of Hjellming & Johnston (1981) fit to the radio images of the kpc-scale jets in RBS 797. Contours are the same as those shown in Fig. 2. The red line represents the receding jet path and the blue line represents the approaching jet path. The location of the green crosses corresponds to the position of the observed hotspots, while their extent represents the resolution of the radio observation (the beam is shown in the bottom left corner) Best fit parameters are reported in the top left corner. We note that the uncertainties on the best fit parameters represent the combination of statistical and systematic uncertainties (see Sect. 4.1.1 for details).
Current usage metrics show cumulative count of Article Views (full-text article views including HTML views, PDF and ePub downloads, according to the available data) and Abstracts Views on Vision4Press platform.
Data correspond to usage on the plateform after 2015. The current usage metrics is available 48-96 hours after online publication and is updated daily on week days.
Initial download of the metrics may take a while.