Fig. 6.
Download original image
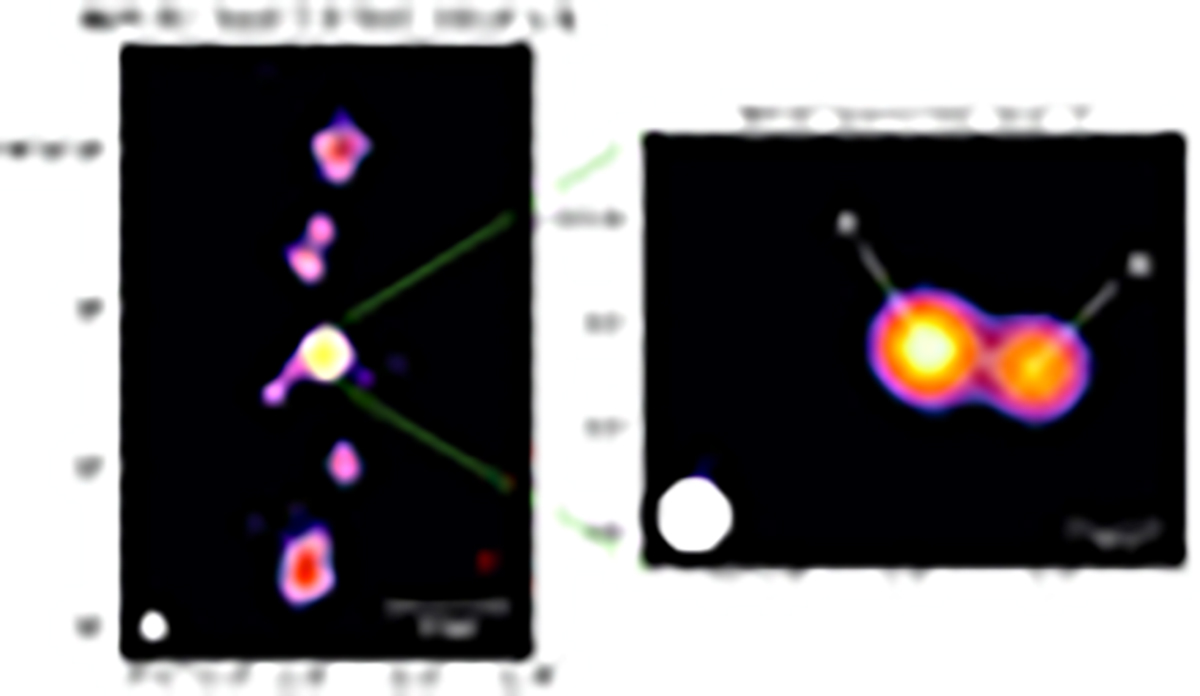
e-Merlin images at 1.6 GHz (left) and 5 GHz (right) of RBS 797. In both panels, contours are drawn at 5σrms, and increase by a factor of 2; the first negative contour (at −5σrms) is drawn in dashed red (not visible in the right panel). The beam is shown in the bottom left corner (0.15″×0.15″ at 1.6 GHz and 0.035″×0.035″ at 5 GHz). See Table 2 for details on the resolution and noise level of the images. Structures discussed in this work are labeled.
Current usage metrics show cumulative count of Article Views (full-text article views including HTML views, PDF and ePub downloads, according to the available data) and Abstracts Views on Vision4Press platform.
Data correspond to usage on the plateform after 2015. The current usage metrics is available 48-96 hours after online publication and is updated daily on week days.
Initial download of the metrics may take a while.