Fig. 4.
Download original image
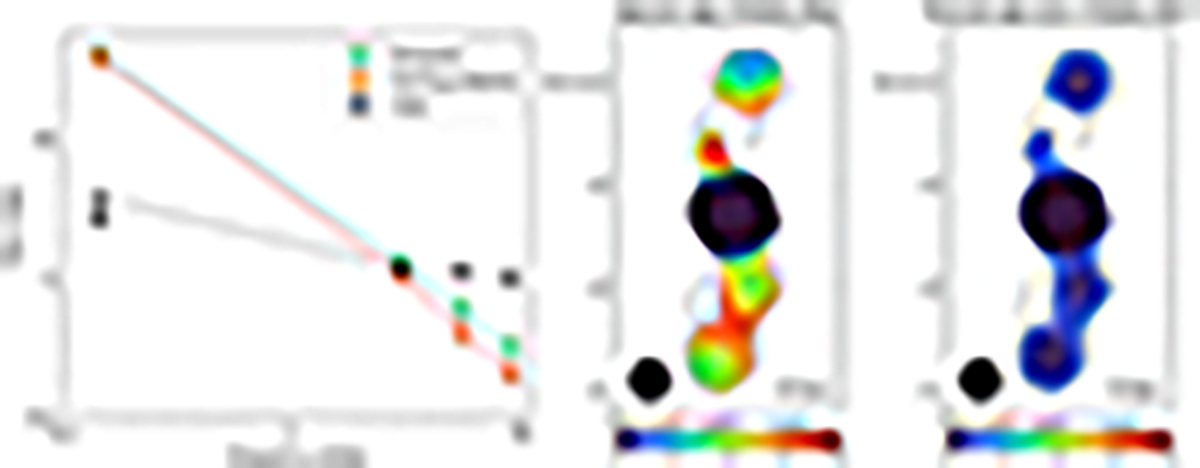
Spectra and radiative ages of the inner jets. Left panel: Radio spectrum of the different components (core, hotspots, and trailing regions) of the north – south radio emission on kiloparsec scales. The total radio spectrum of the hotspots has been obtained by summing the flux densities of the four hotspots within beam-sized regions. The 144 MHz flux density of the core is interpreted as an upper limit, since the core is not detected at low frequency (see Sect. 3.1.2 for details). Note that the dotted lines connecting the points do not represent fits to the spectrum. Right panel: Spectral age map (assuming a Tribble model) and associated uncertainty map. Contours from the 3 GHz map used for the spectral index computation (Fig. 3) are displayed on top of the image. The beam is shown in the bottom left corner. See Sect. 3.1.2 for details.
Current usage metrics show cumulative count of Article Views (full-text article views including HTML views, PDF and ePub downloads, according to the available data) and Abstracts Views on Vision4Press platform.
Data correspond to usage on the plateform after 2015. The current usage metrics is available 48-96 hours after online publication and is updated daily on week days.
Initial download of the metrics may take a while.