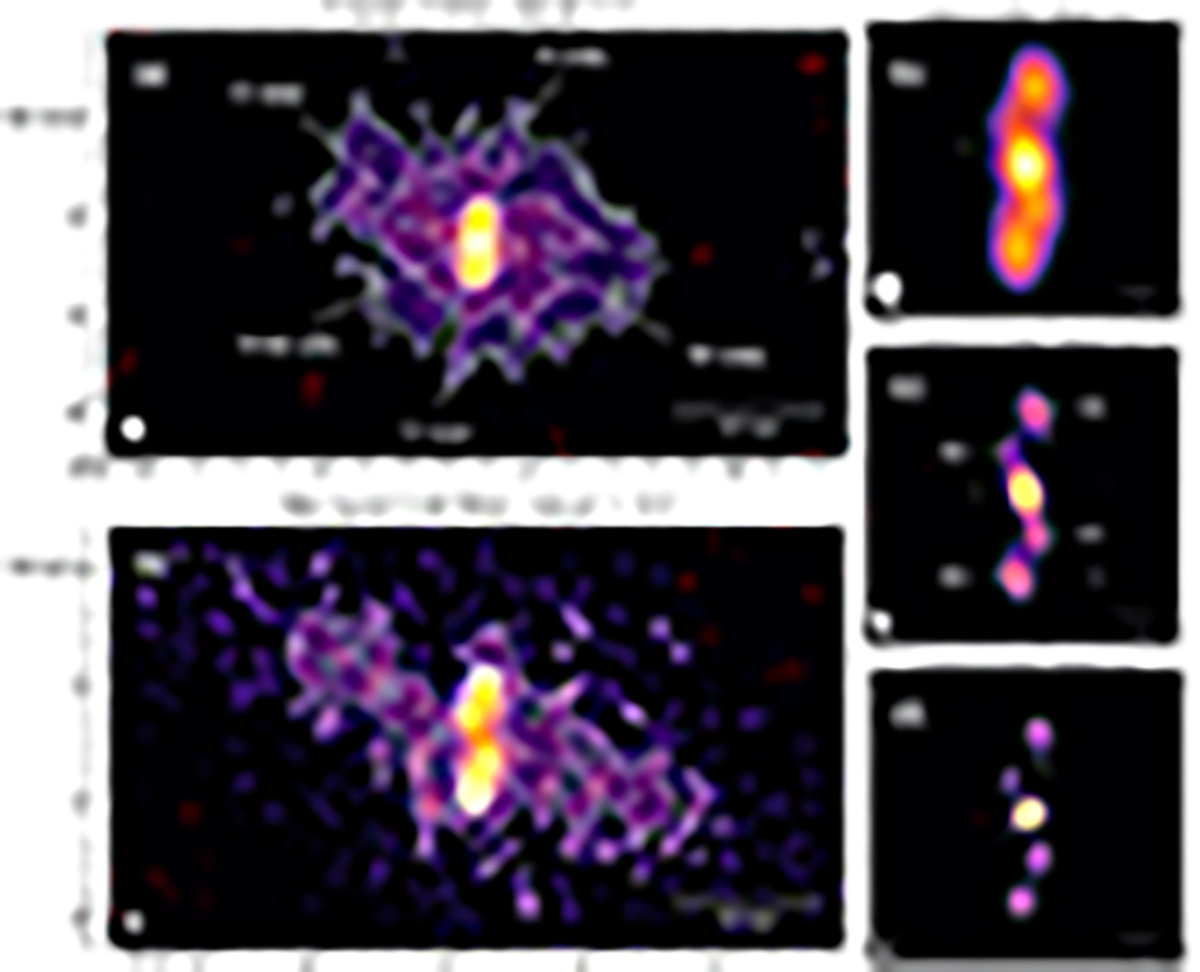
Fig. 2.
Download original image
Final JVLA and LOFAR maps of RBS 797. (a) 3 GHz JVLA image at 0.9″ resolution, obtained by setting the robust parameter to 2. (b)–(d) 3 GHz, 5.5 GHz, and 9 GHz JVLA images obtained by setting robust = 0. The beam sizes are 0.59″×0.40″ at 3 GHz, 0.39″×0.25″ at 5.5 GHz, and 0.23″×0.20″ at 9 GHz. (e) 144 MHz LOFAR image with the International Stations at 0.36″×0.25″ resolution, obtained by setting robust = –0.5. In each panel, the beam is shown with a white circle in the bottom left corner. In panels (a) and (e), contours start at 3σrms and increase by a factor of 2; in panels (b), (c), and (d), contours start at 5σrms and increase by a factor of 2. The first negative contour (−3σrms or −5σrms) is plotted in dashed red. See Table 2 for the σrms noise levels of the images. Structures discussed in this work are labeled.
Current usage metrics show cumulative count of Article Views (full-text article views including HTML views, PDF and ePub downloads, according to the available data) and Abstracts Views on Vision4Press platform.
Data correspond to usage on the plateform after 2015. The current usage metrics is available 48-96 hours after online publication and is updated daily on week days.
Initial download of the metrics may take a while.