Open Access
Fig. 9.
Download original image
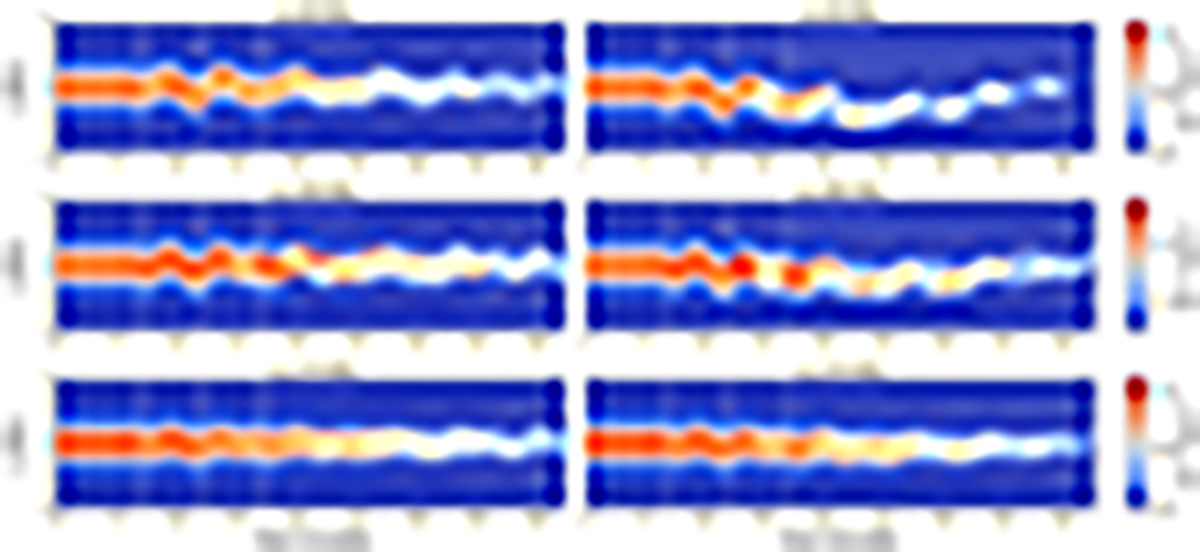
Time distance maps of the density, integrated along the y-axis, for the our loop at different heights. The left panels are for the detrended driver and the right panels for the red noise driver. Vertical dashed lines are added at t = 7, 12, and 17 min.
Current usage metrics show cumulative count of Article Views (full-text article views including HTML views, PDF and ePub downloads, according to the available data) and Abstracts Views on Vision4Press platform.
Data correspond to usage on the plateform after 2015. The current usage metrics is available 48-96 hours after online publication and is updated daily on week days.
Initial download of the metrics may take a while.