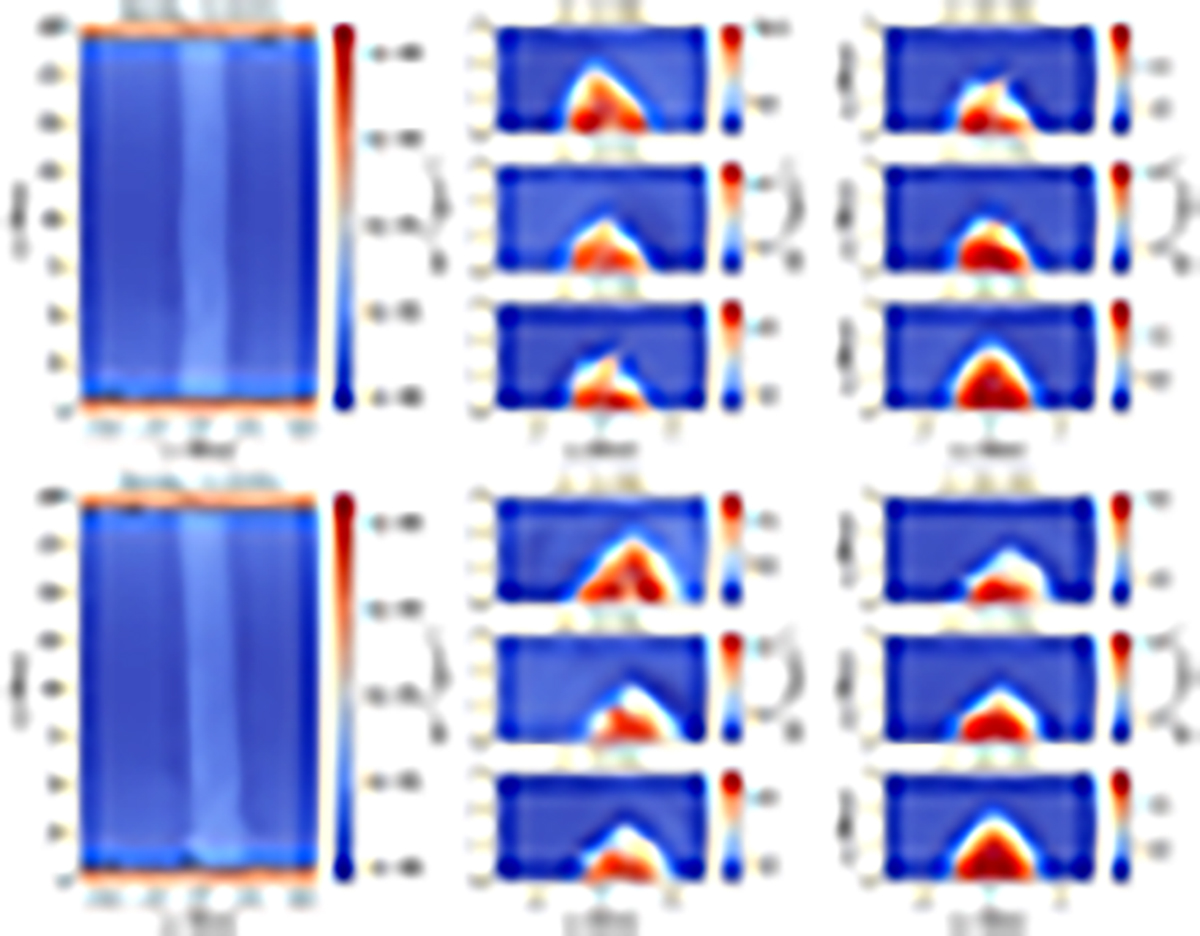
Fig. 8.
Download original image
Integrated density along the y-axis and cross-sections of our loop at different heights, shown at time t = 2552 s. The top panels are for the detrended driver and the bottom panels are for the red noise driver. The black contour lines show the heights where the integrated temperature along the y-axis gets the value T = 0.4 MK. Animations of the two panels are included in the online version of this manuscript.
Current usage metrics show cumulative count of Article Views (full-text article views including HTML views, PDF and ePub downloads, according to the available data) and Abstracts Views on Vision4Press platform.
Data correspond to usage on the plateform after 2015. The current usage metrics is available 48-96 hours after online publication and is updated daily on week days.
Initial download of the metrics may take a while.