Fig. 7.
Download original image
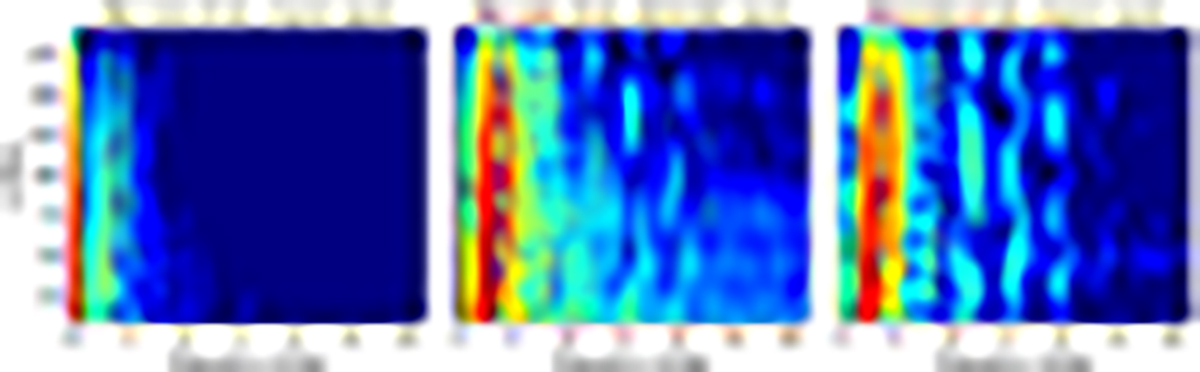
Fourier power spectral density (PSD) profiles of the centre of mass displacement, along the coronal part of our loop. The left panel corresponds to the loop perturbed by the red noise driver. The middle panel corresponds to the detrended version of the displacement signal generated by the red noise driver. The right panel corresponds to the loop perturbed by the detrended driver. The PSD resolution along z equals the numerical resolution of our set-ups.
Current usage metrics show cumulative count of Article Views (full-text article views including HTML views, PDF and ePub downloads, according to the available data) and Abstracts Views on Vision4Press platform.
Data correspond to usage on the plateform after 2015. The current usage metrics is available 48-96 hours after online publication and is updated daily on week days.
Initial download of the metrics may take a while.