Open Access
Fig. 6.
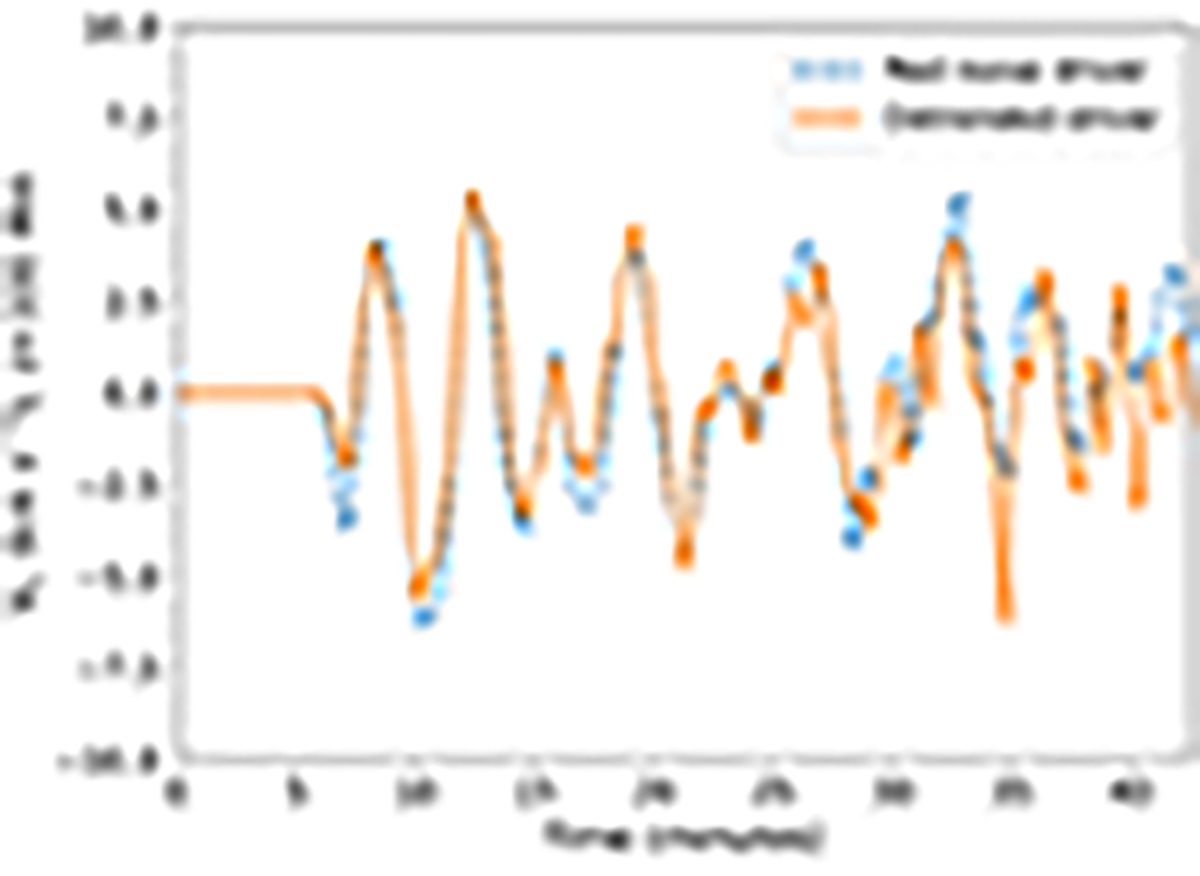
Download original image
Velocity profiles at z = 100 Mm (apex), calculated from the centre of mass displacement along the direction of oscillation (x direction) for the two oscillating loops. The blue dashed line and the orange solid line correspond to the transverse oscillations excited by the red noise driver and detrended driver, respectively.
Current usage metrics show cumulative count of Article Views (full-text article views including HTML views, PDF and ePub downloads, according to the available data) and Abstracts Views on Vision4Press platform.
Data correspond to usage on the plateform after 2015. The current usage metrics is available 48-96 hours after online publication and is updated daily on week days.
Initial download of the metrics may take a while.