Fig. 3.
Download original image
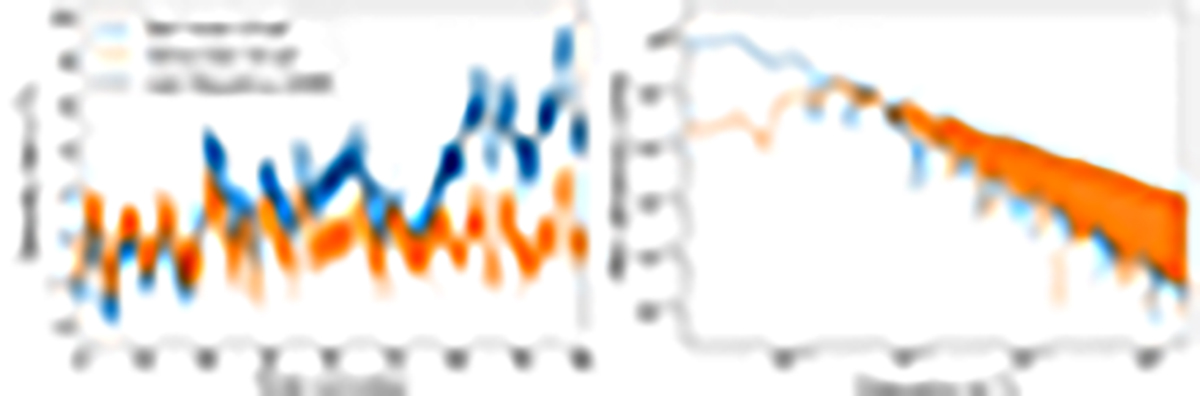
Velocity profiles (left panel) and spectra (right panel) for our drivers. The blue curve corresponds to the red noise signal with a power-law (∝f−1.66) spectrum, and the orange curve to the detrended signal with spectrum S ∝ f−1.66 for f ≳ 2 mHz and reduced power at the lower frequencies. The black dashed line shows the background trend for the original velocity signal.
Current usage metrics show cumulative count of Article Views (full-text article views including HTML views, PDF and ePub downloads, according to the available data) and Abstracts Views on Vision4Press platform.
Data correspond to usage on the plateform after 2015. The current usage metrics is available 48-96 hours after online publication and is updated daily on week days.
Initial download of the metrics may take a while.