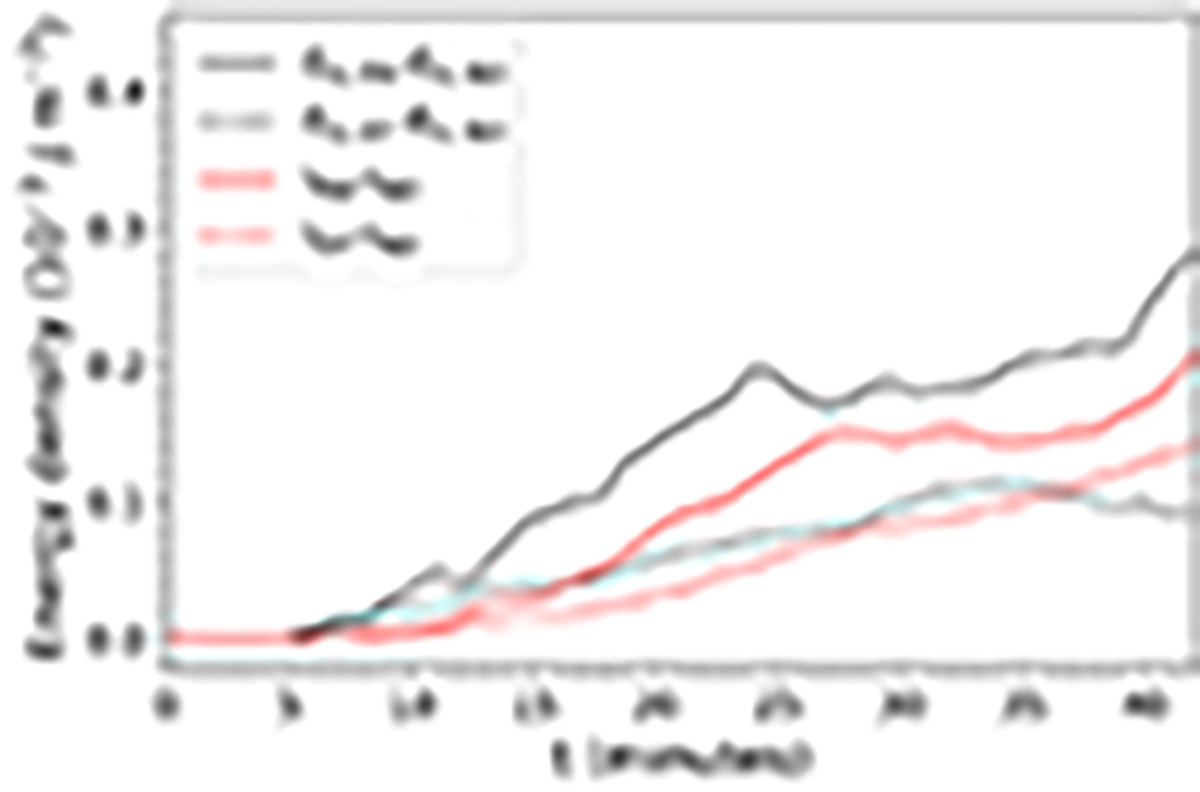
Fig. 12.
Download original image
Energy density profiles over time, relative to the non-driven case (ND). The solid lines correspond to the results for the red noise driver (RN) and the dashed lines for the detrended driver (DT). The total Poynting energy input (black lines) from z = 7 Mm and z = 193 Mm and the internal energy (red lines) for the coronal part of the loop (x ∈ [ − 6, 6] Mm, y ∈ [0, 4] Mm and z ∈ [7, 193] Mm) are shown.
Current usage metrics show cumulative count of Article Views (full-text article views including HTML views, PDF and ePub downloads, according to the available data) and Abstracts Views on Vision4Press platform.
Data correspond to usage on the plateform after 2015. The current usage metrics is available 48-96 hours after online publication and is updated daily on week days.
Initial download of the metrics may take a while.