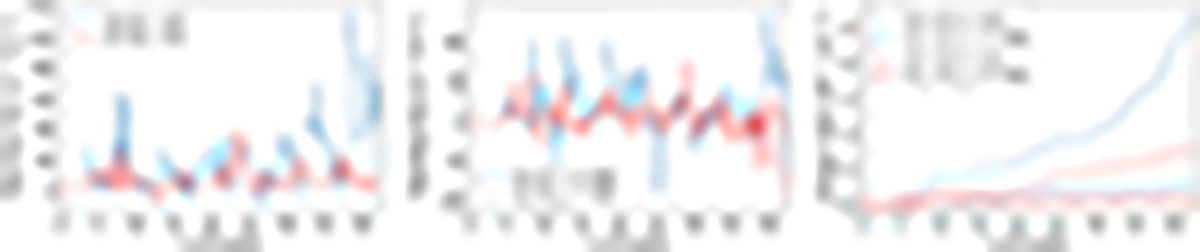
Fig. 11.
Download original image
The Poynting flux graphs (left and middle panels) and input energy density graphs (right panel) over time for the red noise driver (solid blue line, RN subscript) and the detrended driver (red line, DT subscript) relative to the non-driven case (ND). The Poynting energy density input at the approximate height of the transition region (z = 7 Mm) is also given for both drivers (dashed lines).
Current usage metrics show cumulative count of Article Views (full-text article views including HTML views, PDF and ePub downloads, according to the available data) and Abstracts Views on Vision4Press platform.
Data correspond to usage on the plateform after 2015. The current usage metrics is available 48-96 hours after online publication and is updated daily on week days.
Initial download of the metrics may take a while.