Fig. 10.
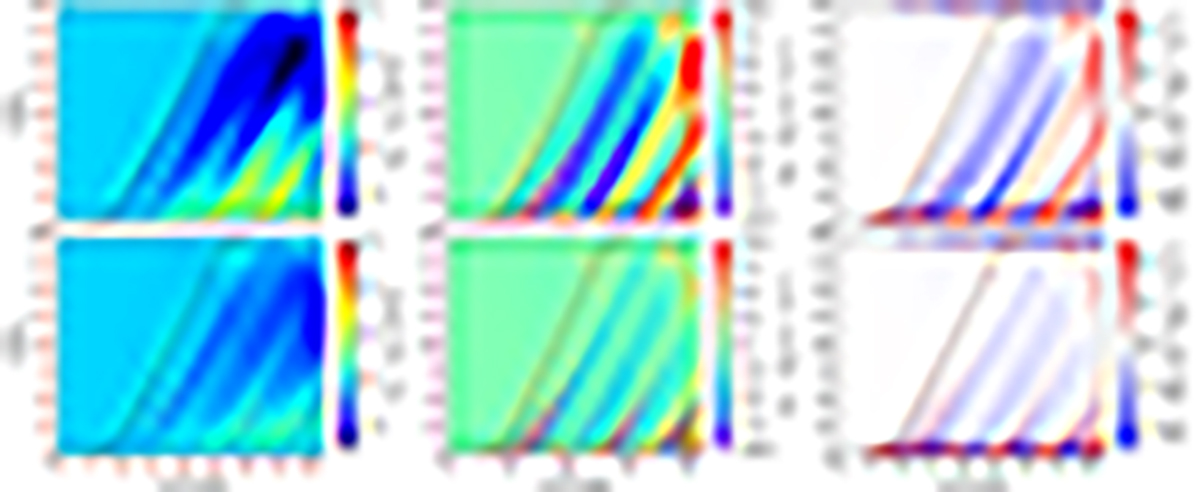
Download original image
Height vs. time profiles of the temperature difference (left panels), enthalpy flux difference (middle panels), and mass flux difference (right panels), for the set-ups with the red noise driver (RN, top) and detrended driver (DT, bottom) with respect to the non-driven case (ND). The horizontal dotted black lines show the location of the T = 0.4 MK line. The black dashed lines show the estimated trajectory of a plasma parcel launched from one footpoint, with a varying velocity with height, equal to the average sound speed across the loop at each height, at t = 5 min.
Current usage metrics show cumulative count of Article Views (full-text article views including HTML views, PDF and ePub downloads, according to the available data) and Abstracts Views on Vision4Press platform.
Data correspond to usage on the plateform after 2015. The current usage metrics is available 48-96 hours after online publication and is updated daily on week days.
Initial download of the metrics may take a while.