Fig. 7
Download original image
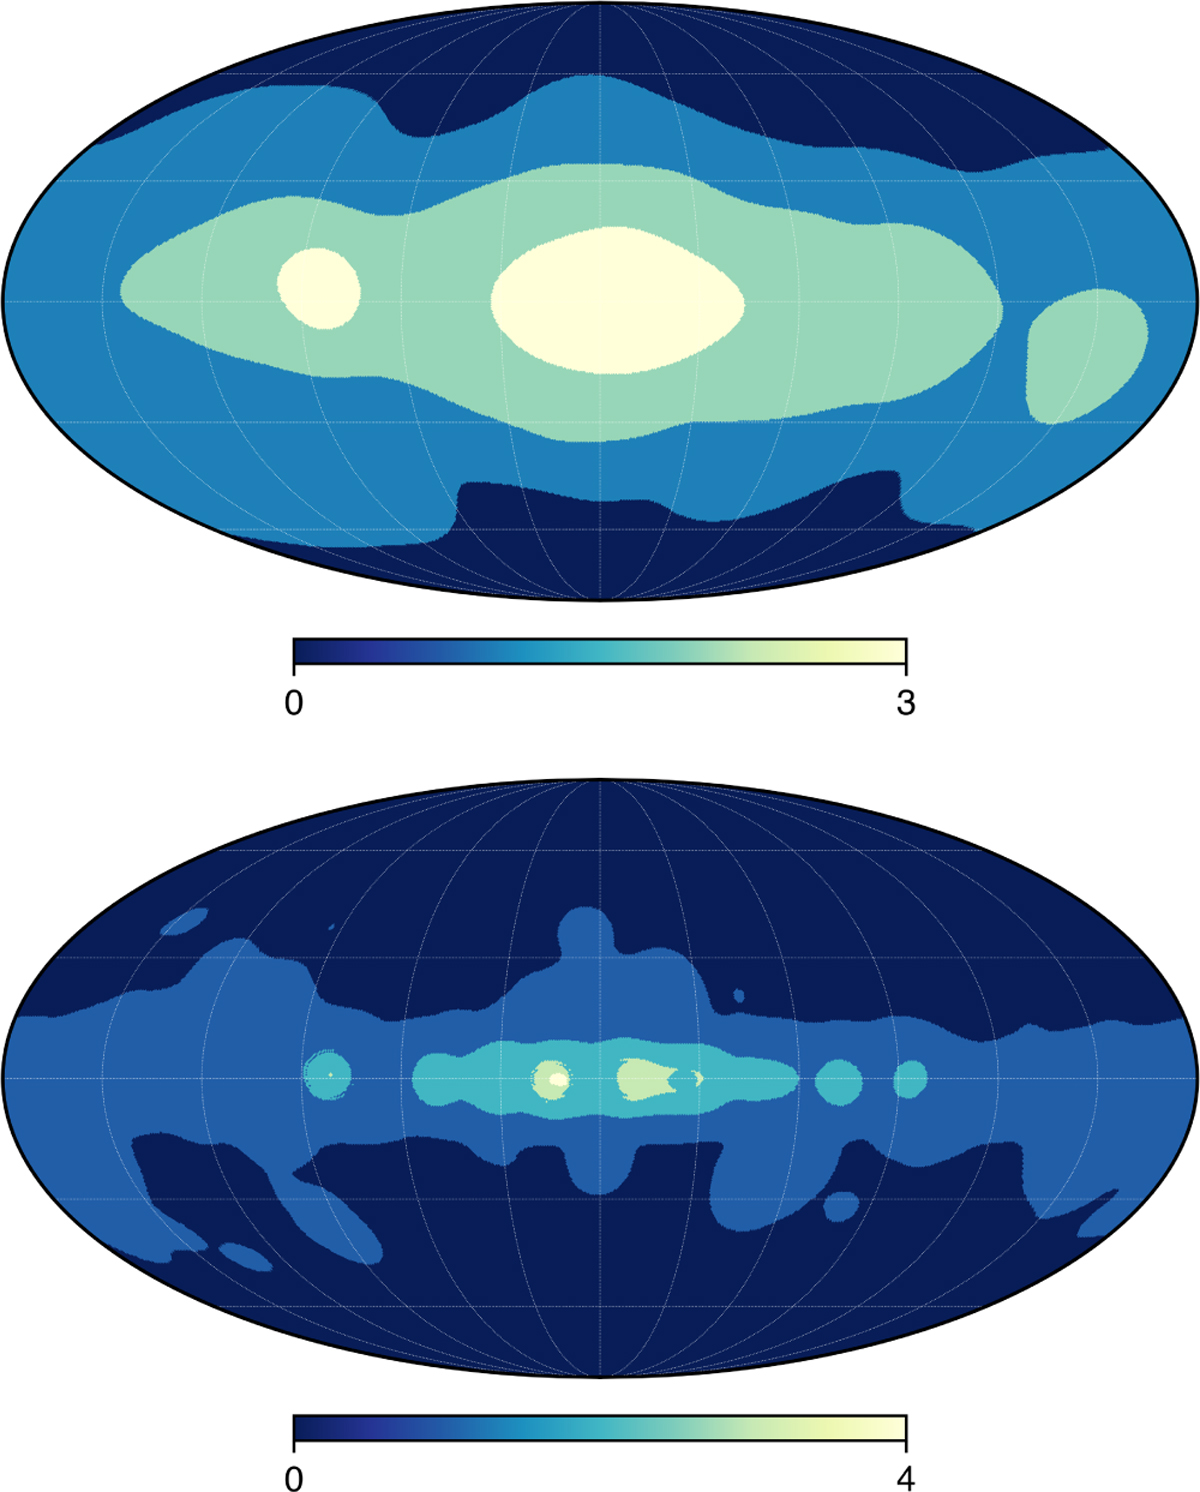
Maps of dimension of CO subspace as determined by GNILC for the 60′ needlet band (top) and the 10′ needlet band (bottom). At smaller angular scales, larger parts of the high-latitude sky becomes noise-dominated (dark blue in the figure). The standard GNILC algorithm assigns those regions a zero-dimensional signal subspace, which results in varying effective resolution in standard GNILC map. In our processing, in those needlet domains, we produce the CO maps using the GLS weights. With this modification to the GNILC algorithm, final xGNILC maps are produced with a uniform angular resolution.
Current usage metrics show cumulative count of Article Views (full-text article views including HTML views, PDF and ePub downloads, according to the available data) and Abstracts Views on Vision4Press platform.
Data correspond to usage on the plateform after 2015. The current usage metrics is available 48-96 hours after online publication and is updated daily on week days.
Initial download of the metrics may take a while.