Fig. 2
Download original image
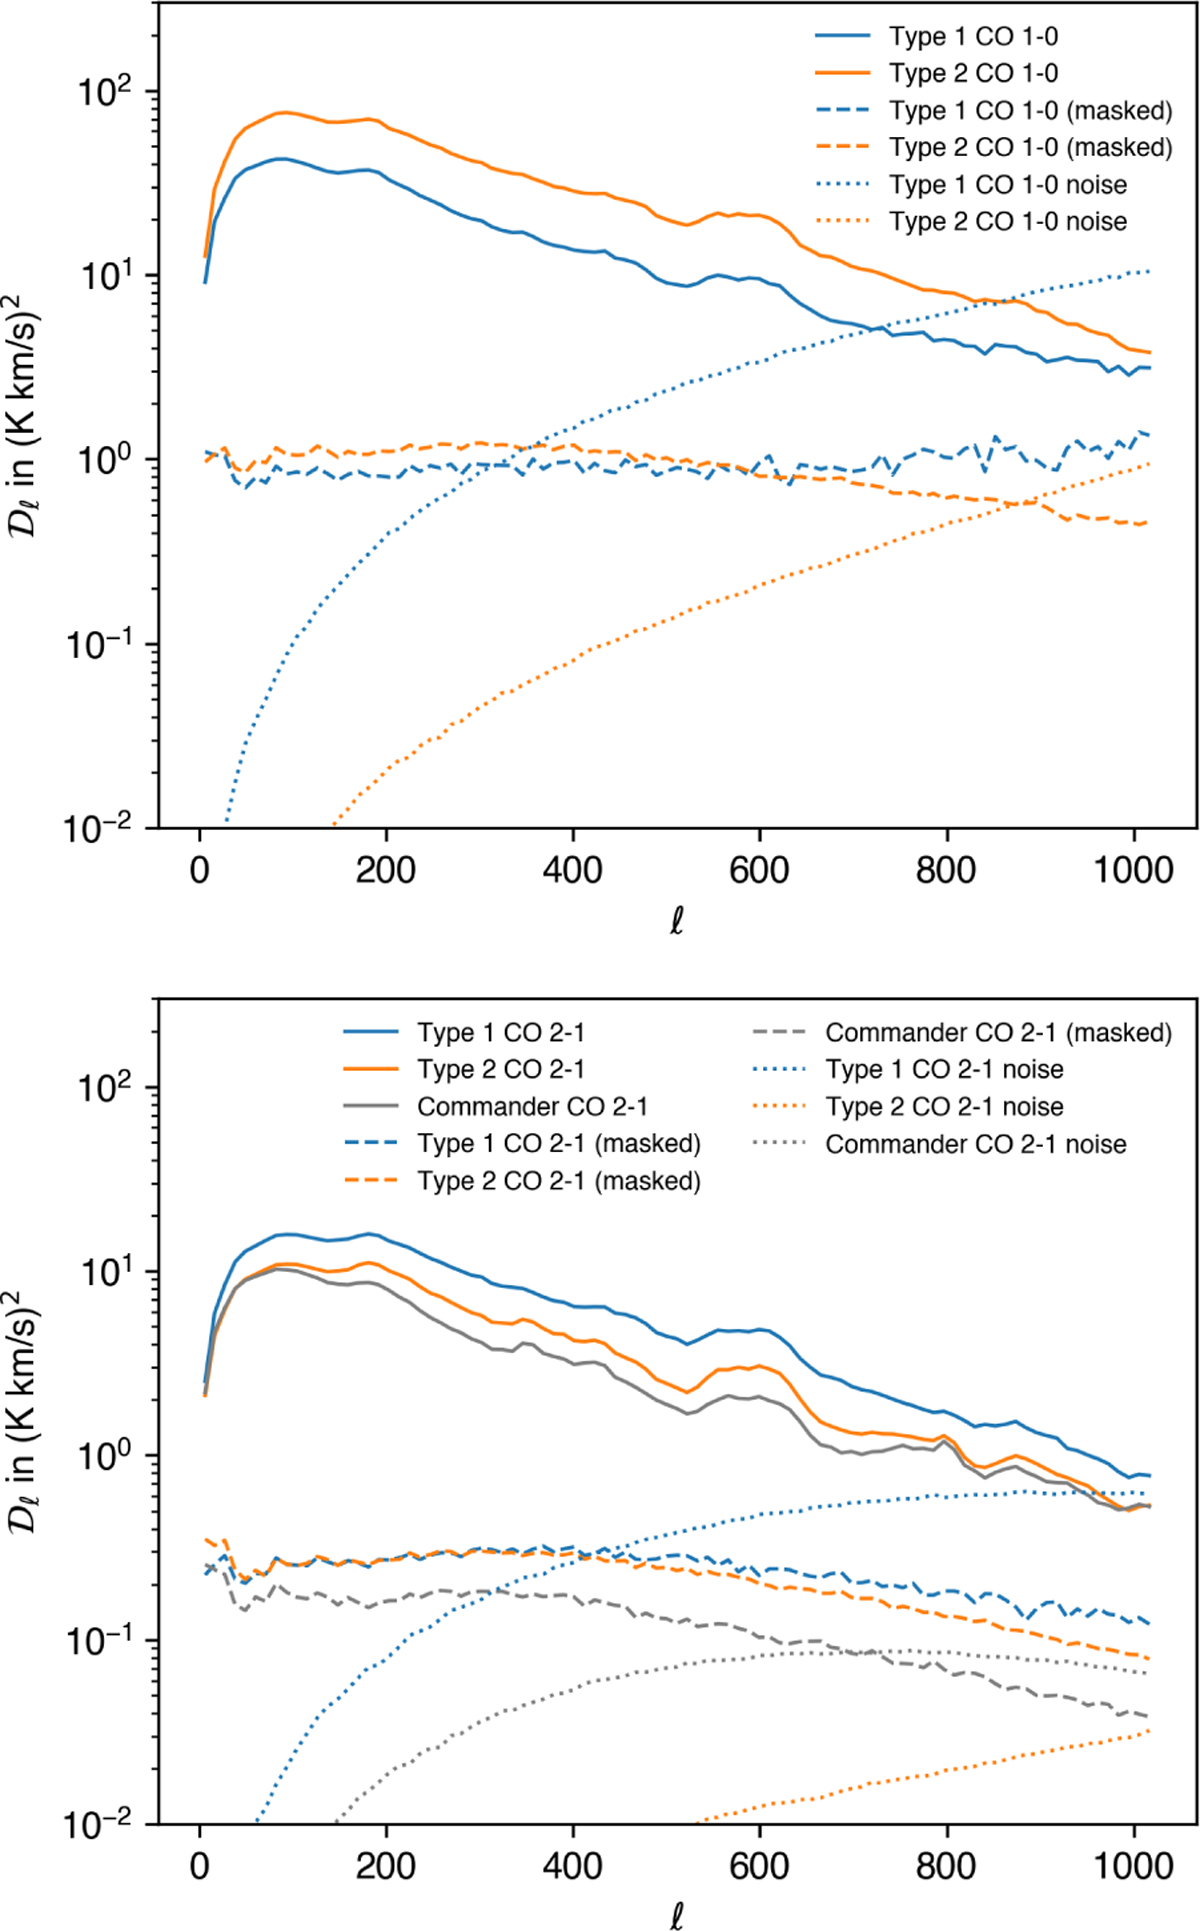
Power spectra comparison of TYPE 1 and TYPE 2 CO J =1 → 0 maps (top) and J = 2 → 1 maps (bottom), with and without an attenuation mask to reduce the amplitude of emission in the brightest 2% of pixels (shown in the top panel of Fig. 3). The TYPE 1 J =1 → 0 have lower power compared to the TYPE 2 map. For the CO J = 2 → 1 line emission, the TYPE 1 map has higher power compared to the TYPE 2 map. Both of them have higher power than the Commander CO J = 2 → 1 map. The discrepancy between TYPE 1 and TYPE 2 CO J = 2 → 1 power spectra largely goes away when masking the regions of strongest CO.
Current usage metrics show cumulative count of Article Views (full-text article views including HTML views, PDF and ePub downloads, according to the available data) and Abstracts Views on Vision4Press platform.
Data correspond to usage on the plateform after 2015. The current usage metrics is available 48-96 hours after online publication and is updated daily on week days.
Initial download of the metrics may take a while.