Fig. 17
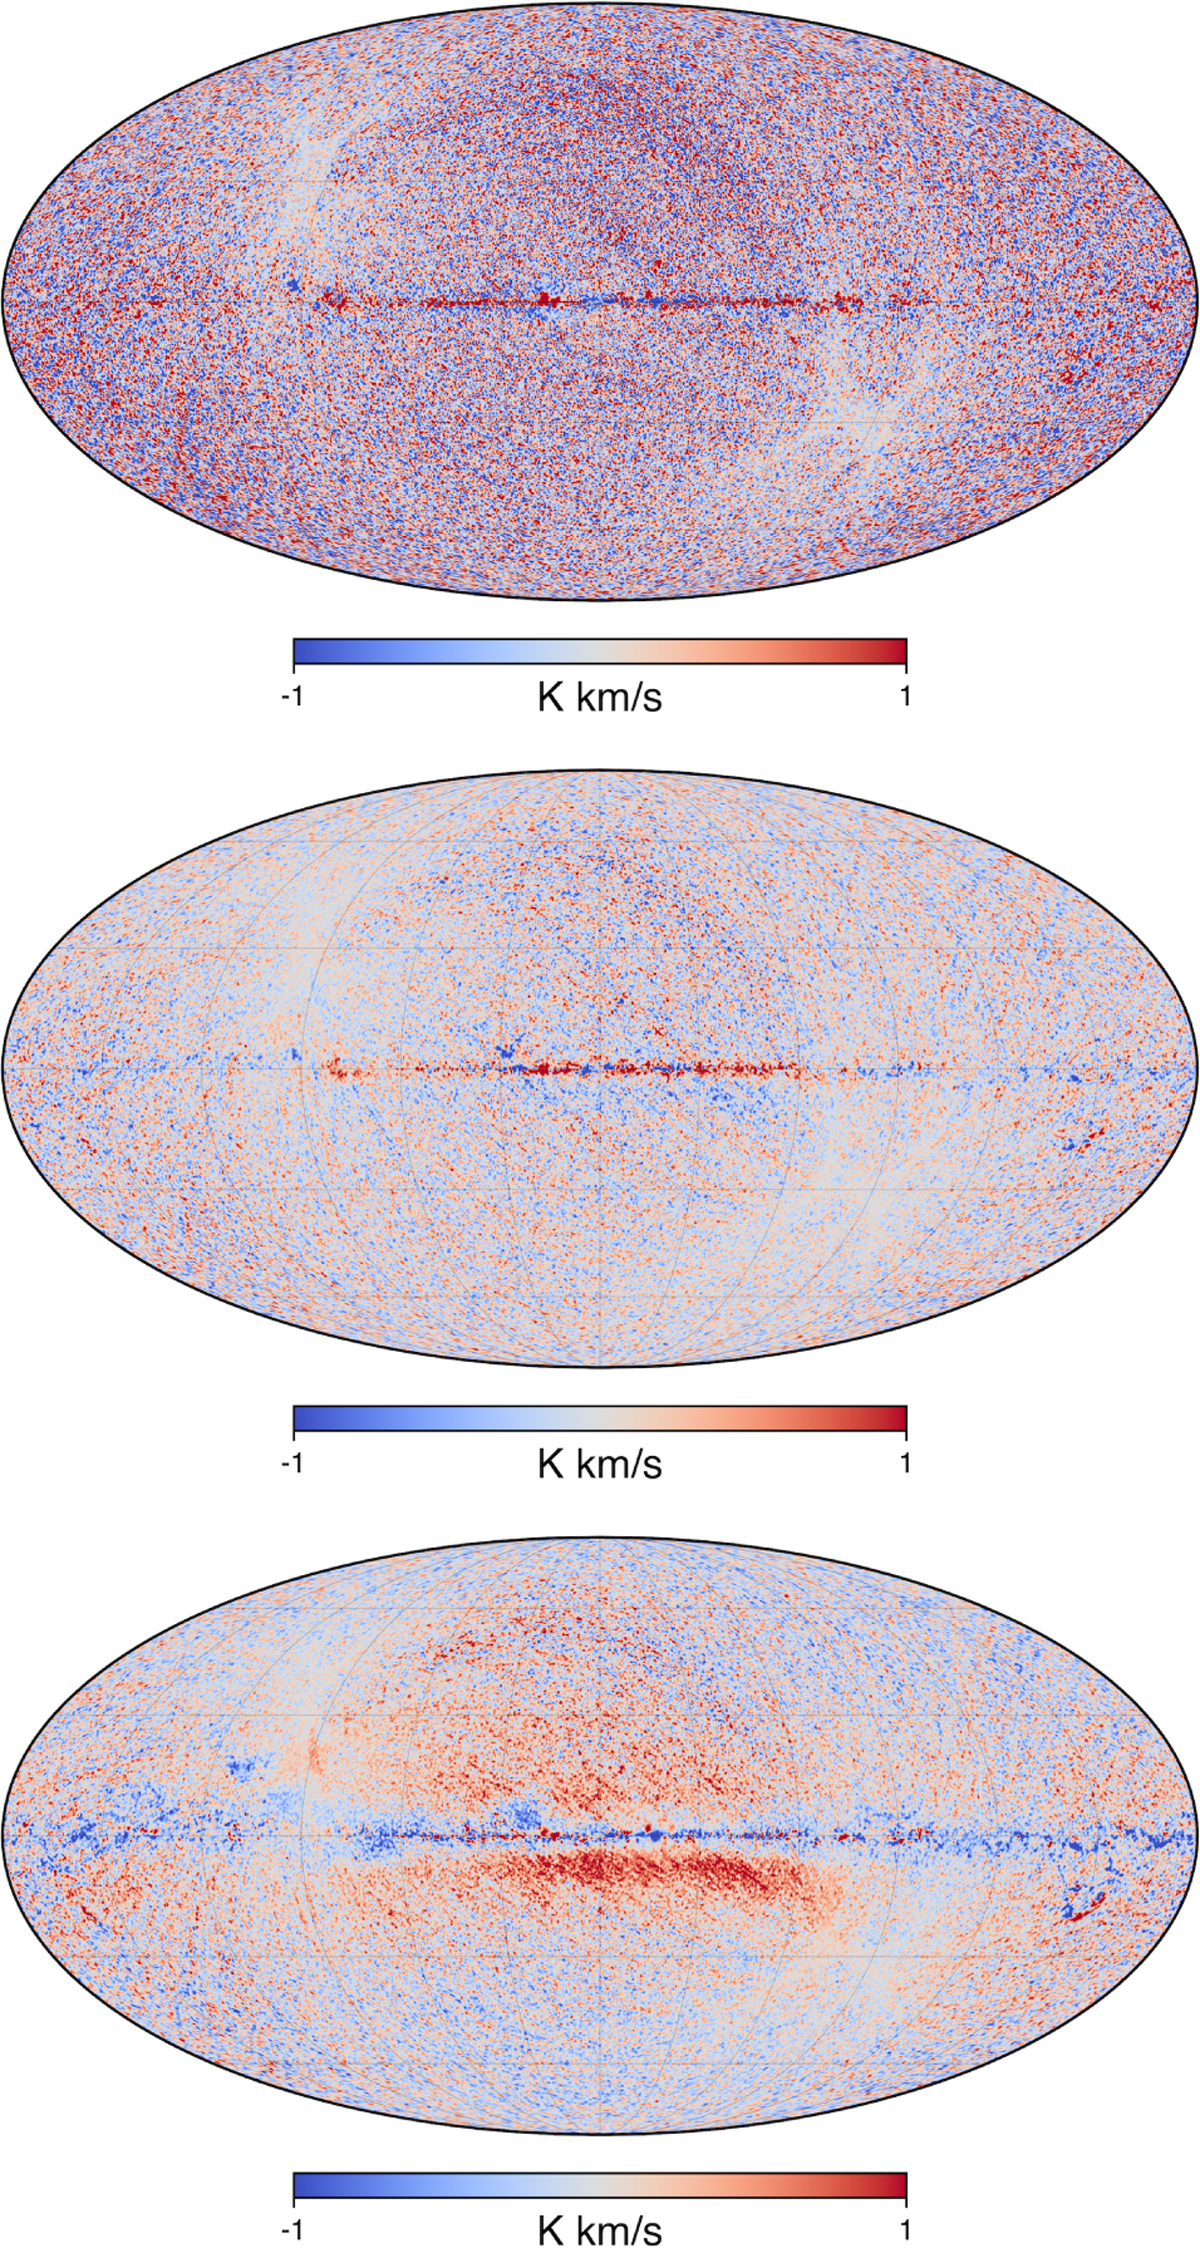
Download original image
Difference maps (Planck TYPE 1 – xGNILC) for CO J = 1 → 0 (top), CO J = 2 → 1 (middle), and CO J = 3 → 2 (bottom) are shown in this figure. Differences are visible in the Galactic plane, but they are a small fraction of the total signal and lower than calibration uncertainties. For CO J = 3 → 2, the effect of the postprocessing of residual systematics shows up as a negative trough close to the Galactic plane and extended bright red regions above and below the Galactic ridge.
Current usage metrics show cumulative count of Article Views (full-text article views including HTML views, PDF and ePub downloads, according to the available data) and Abstracts Views on Vision4Press platform.
Data correspond to usage on the plateform after 2015. The current usage metrics is available 48-96 hours after online publication and is updated daily on week days.
Initial download of the metrics may take a while.