Fig. 16
Download original image
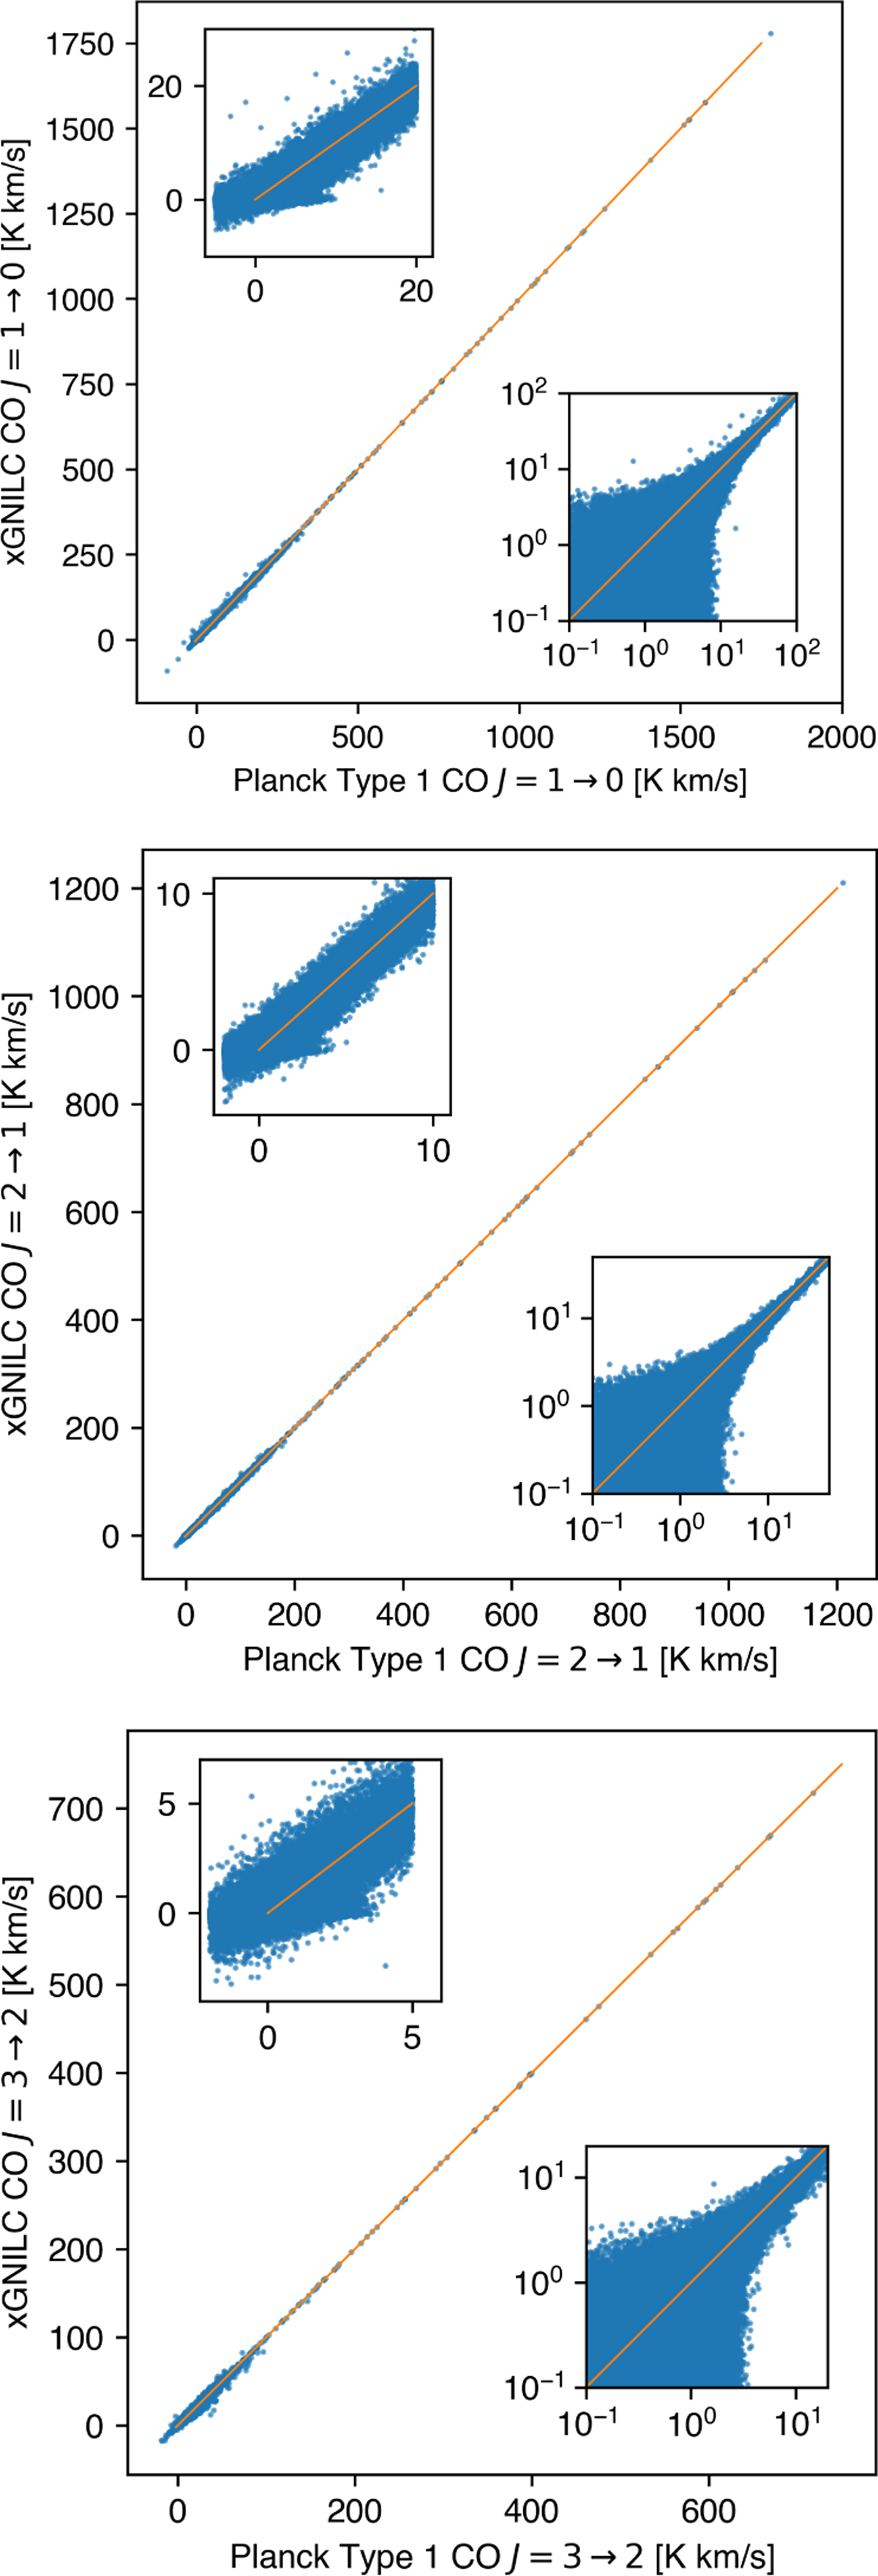
Scatter plot with pixel values of Planck TYPE 1 map as abscissa and pixel values of xGNILC map as ordinate. Top: CO J = 1 → 0; middle: J = 2 → 1; bottom: J = 3 → 2. Planck TYPE 1 maps are smoothed to 10′ resolution, and the HEALPix pixel size is increased to Nside = 256 for this figure. In the inset windows in the upper left corner we show the scatter for low-brightness pixels. In the inset windows located in the bottom right corner, we show the scatter plot in log scale. The orange line indicates y = x in all plots.
Current usage metrics show cumulative count of Article Views (full-text article views including HTML views, PDF and ePub downloads, according to the available data) and Abstracts Views on Vision4Press platform.
Data correspond to usage on the plateform after 2015. The current usage metrics is available 48-96 hours after online publication and is updated daily on week days.
Initial download of the metrics may take a while.