Fig. 14
Download original image
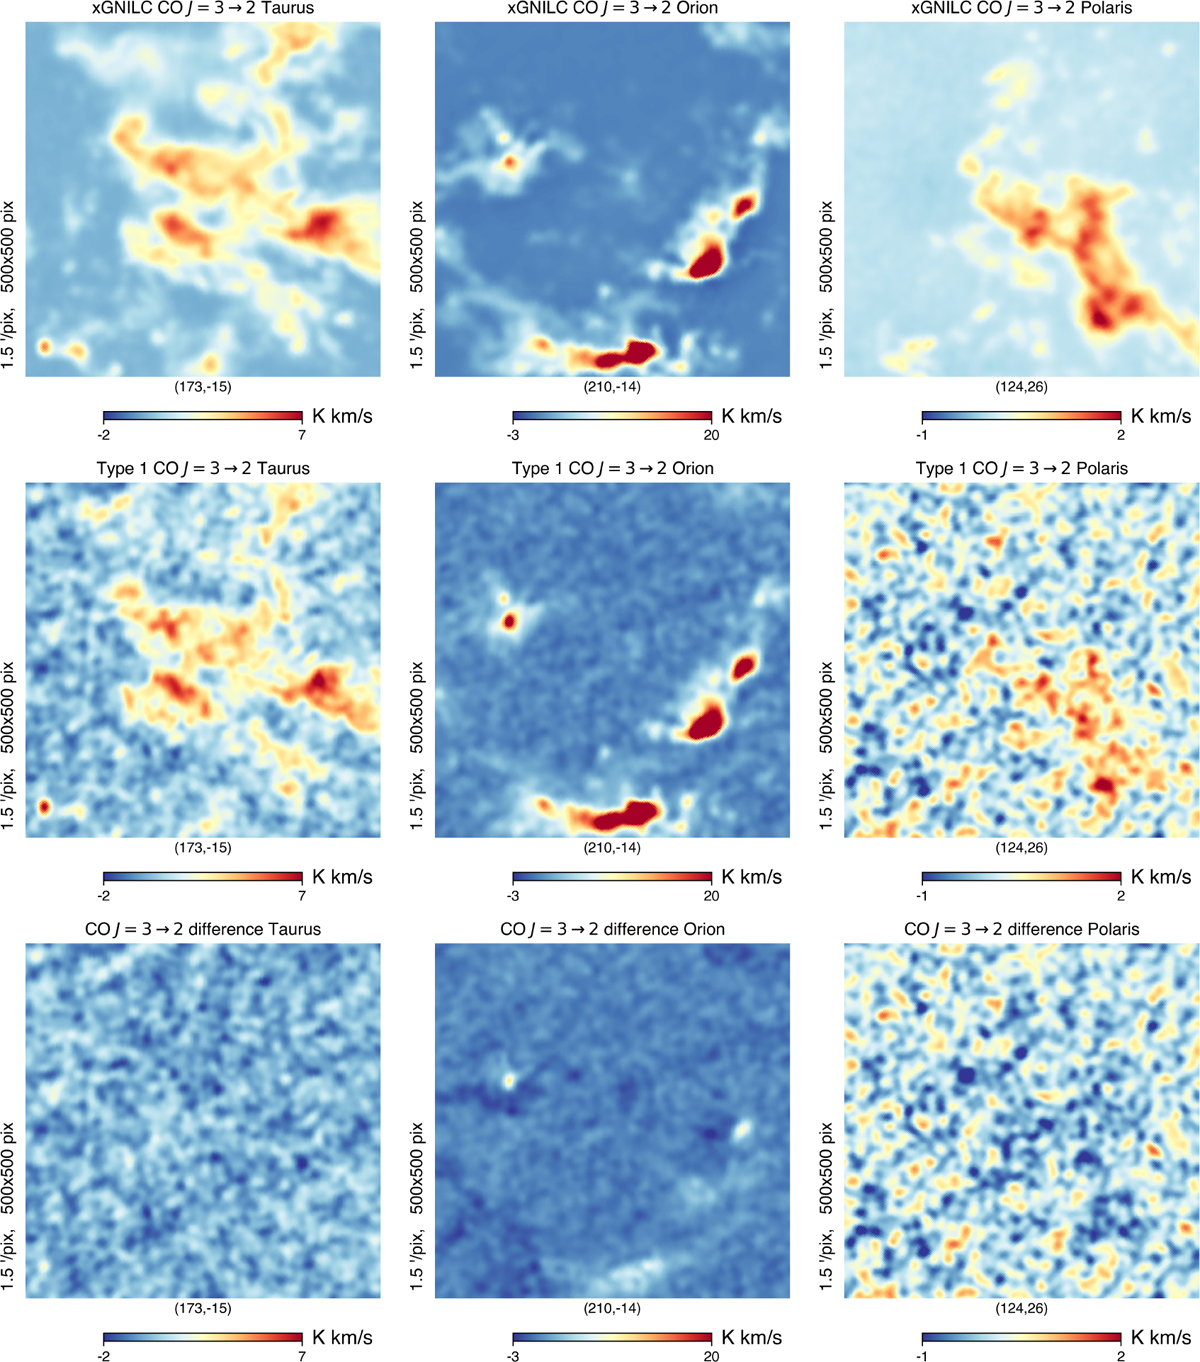
Images (12.5° × 12.5°) of important CO emission regions for CO J = 3 → 2: Taurus (left column), Orion (middle column), and Polaris (right column), at 20′ resolution. The first row shows our xGNILC map, the second row shows the Planck TYPE 1 map, and the third row shows the difference map (Planck TYPE 1 – xGNILC). We have additional smoothing for this comparison as the signal-to-noise level of the Planck map is low.
Current usage metrics show cumulative count of Article Views (full-text article views including HTML views, PDF and ePub downloads, according to the available data) and Abstracts Views on Vision4Press platform.
Data correspond to usage on the plateform after 2015. The current usage metrics is available 48-96 hours after online publication and is updated daily on week days.
Initial download of the metrics may take a while.