Fig. 9
Download original image
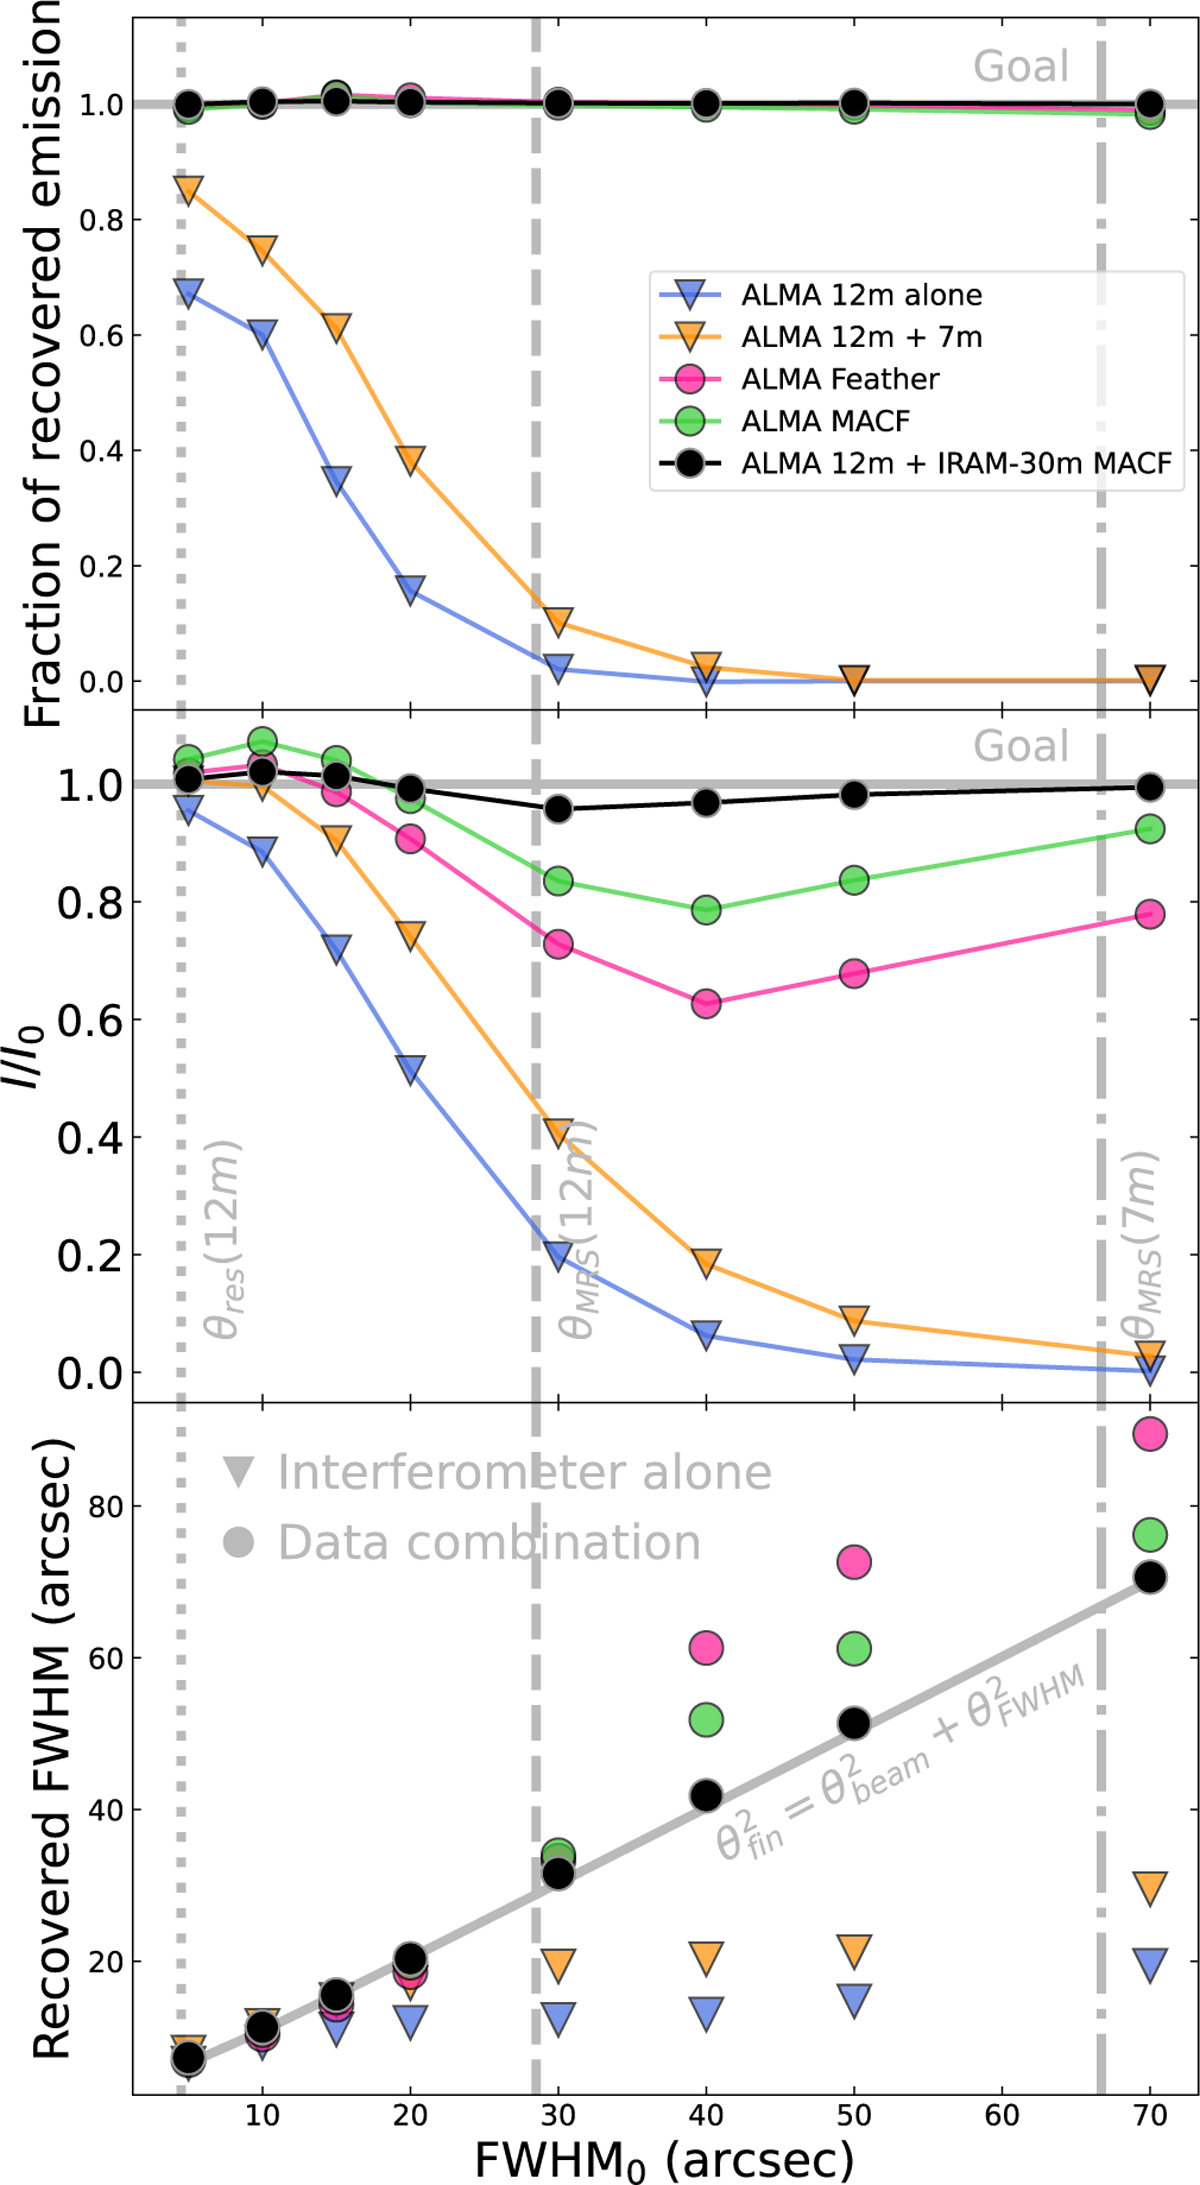
Reconstructed properties of isolated Gaussian filaments. Top: Percentage of emission recovered along the entire radial profile vs. FWHM0 Different colors are used for the different data combination methods used: blue for the ALMA 12 m-alone, orange for the 12 m + 7 m, pink for the ALMA Feather, green for the ALMA MACF, and black for the ALMA 12 m + IRAM-30 m MACF. The grey dotted and dashed lines show θres(12m) and θMRS(12m), respectively. Middle: Intensity peak estimated from the Gaussian fit vs. FWHM0. Bottom: FWHM estimated from the Gaussian fit vs. FWHM0. The grey solid line shows the theoretical expectation. For comparison, the results for the radial profile shown in Fig. 8 with FWHM0 = 30 arcsec correspond to values close to θMRS(12 m).
Current usage metrics show cumulative count of Article Views (full-text article views including HTML views, PDF and ePub downloads, according to the available data) and Abstracts Views on Vision4Press platform.
Data correspond to usage on the plateform after 2015. The current usage metrics is available 48-96 hours after online publication and is updated daily on week days.
Initial download of the metrics may take a while.