Fig. 4
Download original image
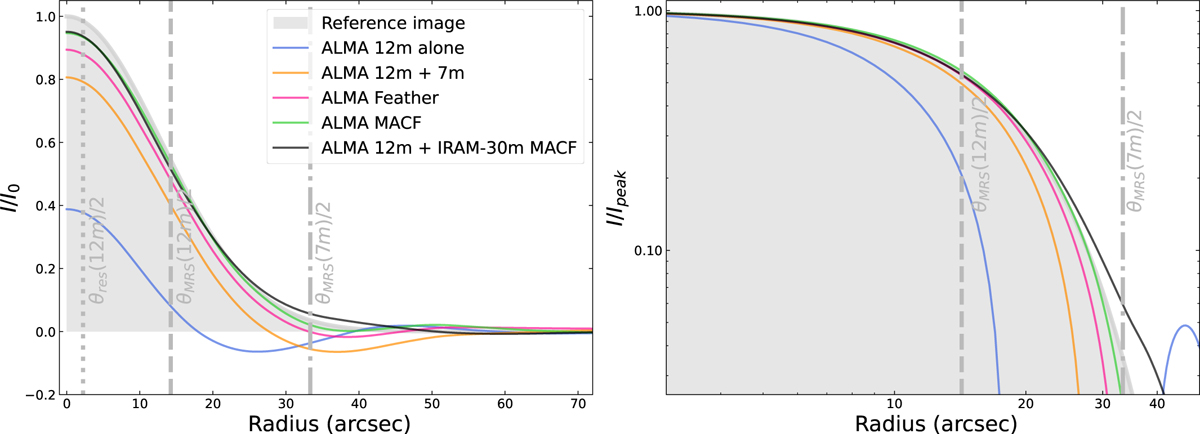
Radial profile extracted from a horizontal cut in the center of a FWHM = 30 arcsec Gaussian core image normalized with respect to the reference image peak (shown by the grey shaded area) displayed in linear scale (left). Same radial profile normalized with respect to its peak value (the reference profile is shown by the grey shaded area) displayed in log-scale (right). The data combination methods used are marked in different colors: ALMA 12 m-alone (blue), ALMA 12 m + 7 m (orange), ALMA Feather (pink), ALMA MACF (green) and ALMA 12 m + IRAM-30 m MACF (black).
Current usage metrics show cumulative count of Article Views (full-text article views including HTML views, PDF and ePub downloads, according to the available data) and Abstracts Views on Vision4Press platform.
Data correspond to usage on the plateform after 2015. The current usage metrics is available 48-96 hours after online publication and is updated daily on week days.
Initial download of the metrics may take a while.