Fig. A.1
Download original image
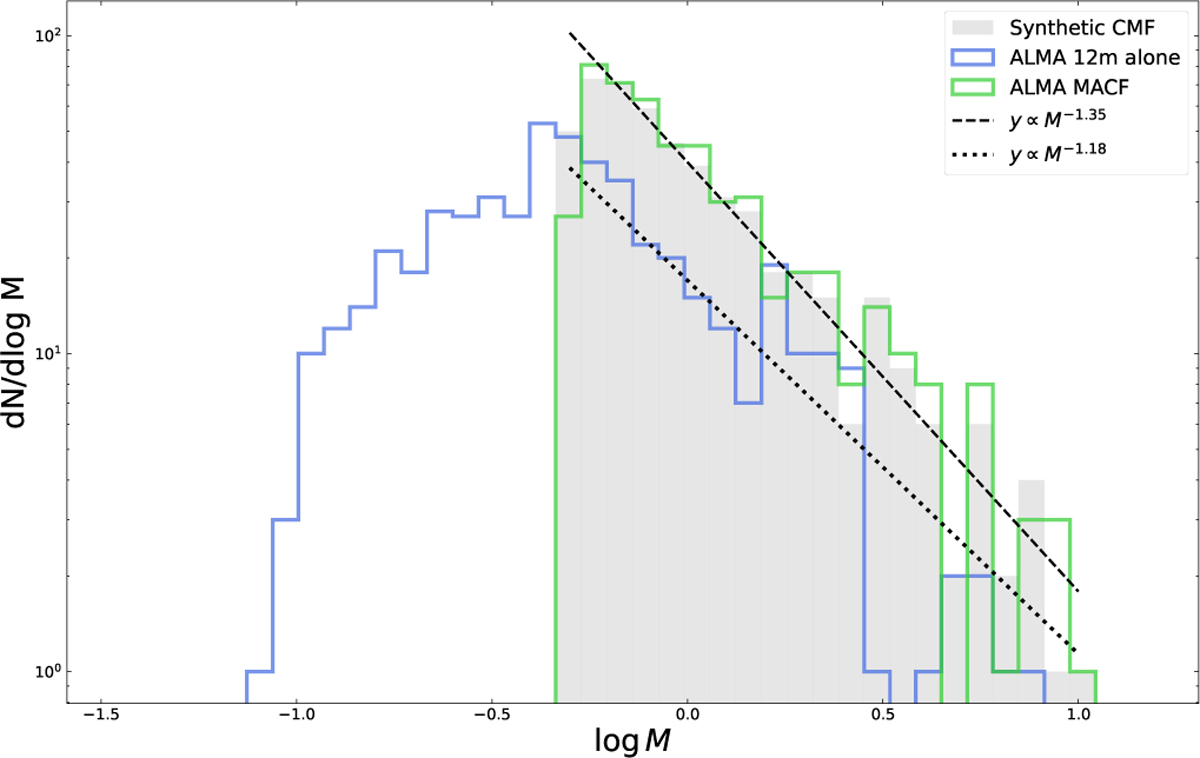
Analysis of the core mass function (CMF). The synthetic Salpeter-like distribution used as input is marked by the grey-shadowed histogram. The blue and green line histograms describe the CMF recovered using the ALMA 12 m-alone and the ALMA MACF, respectively. The black dashed line displays the expected Salpeter dependence (α = 1.35), while the dotted line is the one that better describes the much shallower, top-heavy slope (α = 1.18) observed by the interferometer-only
Current usage metrics show cumulative count of Article Views (full-text article views including HTML views, PDF and ePub downloads, according to the available data) and Abstracts Views on Vision4Press platform.
Data correspond to usage on the plateform after 2015. The current usage metrics is available 48-96 hours after online publication and is updated daily on week days.
Initial download of the metrics may take a while.