Fig. 18
Download original image
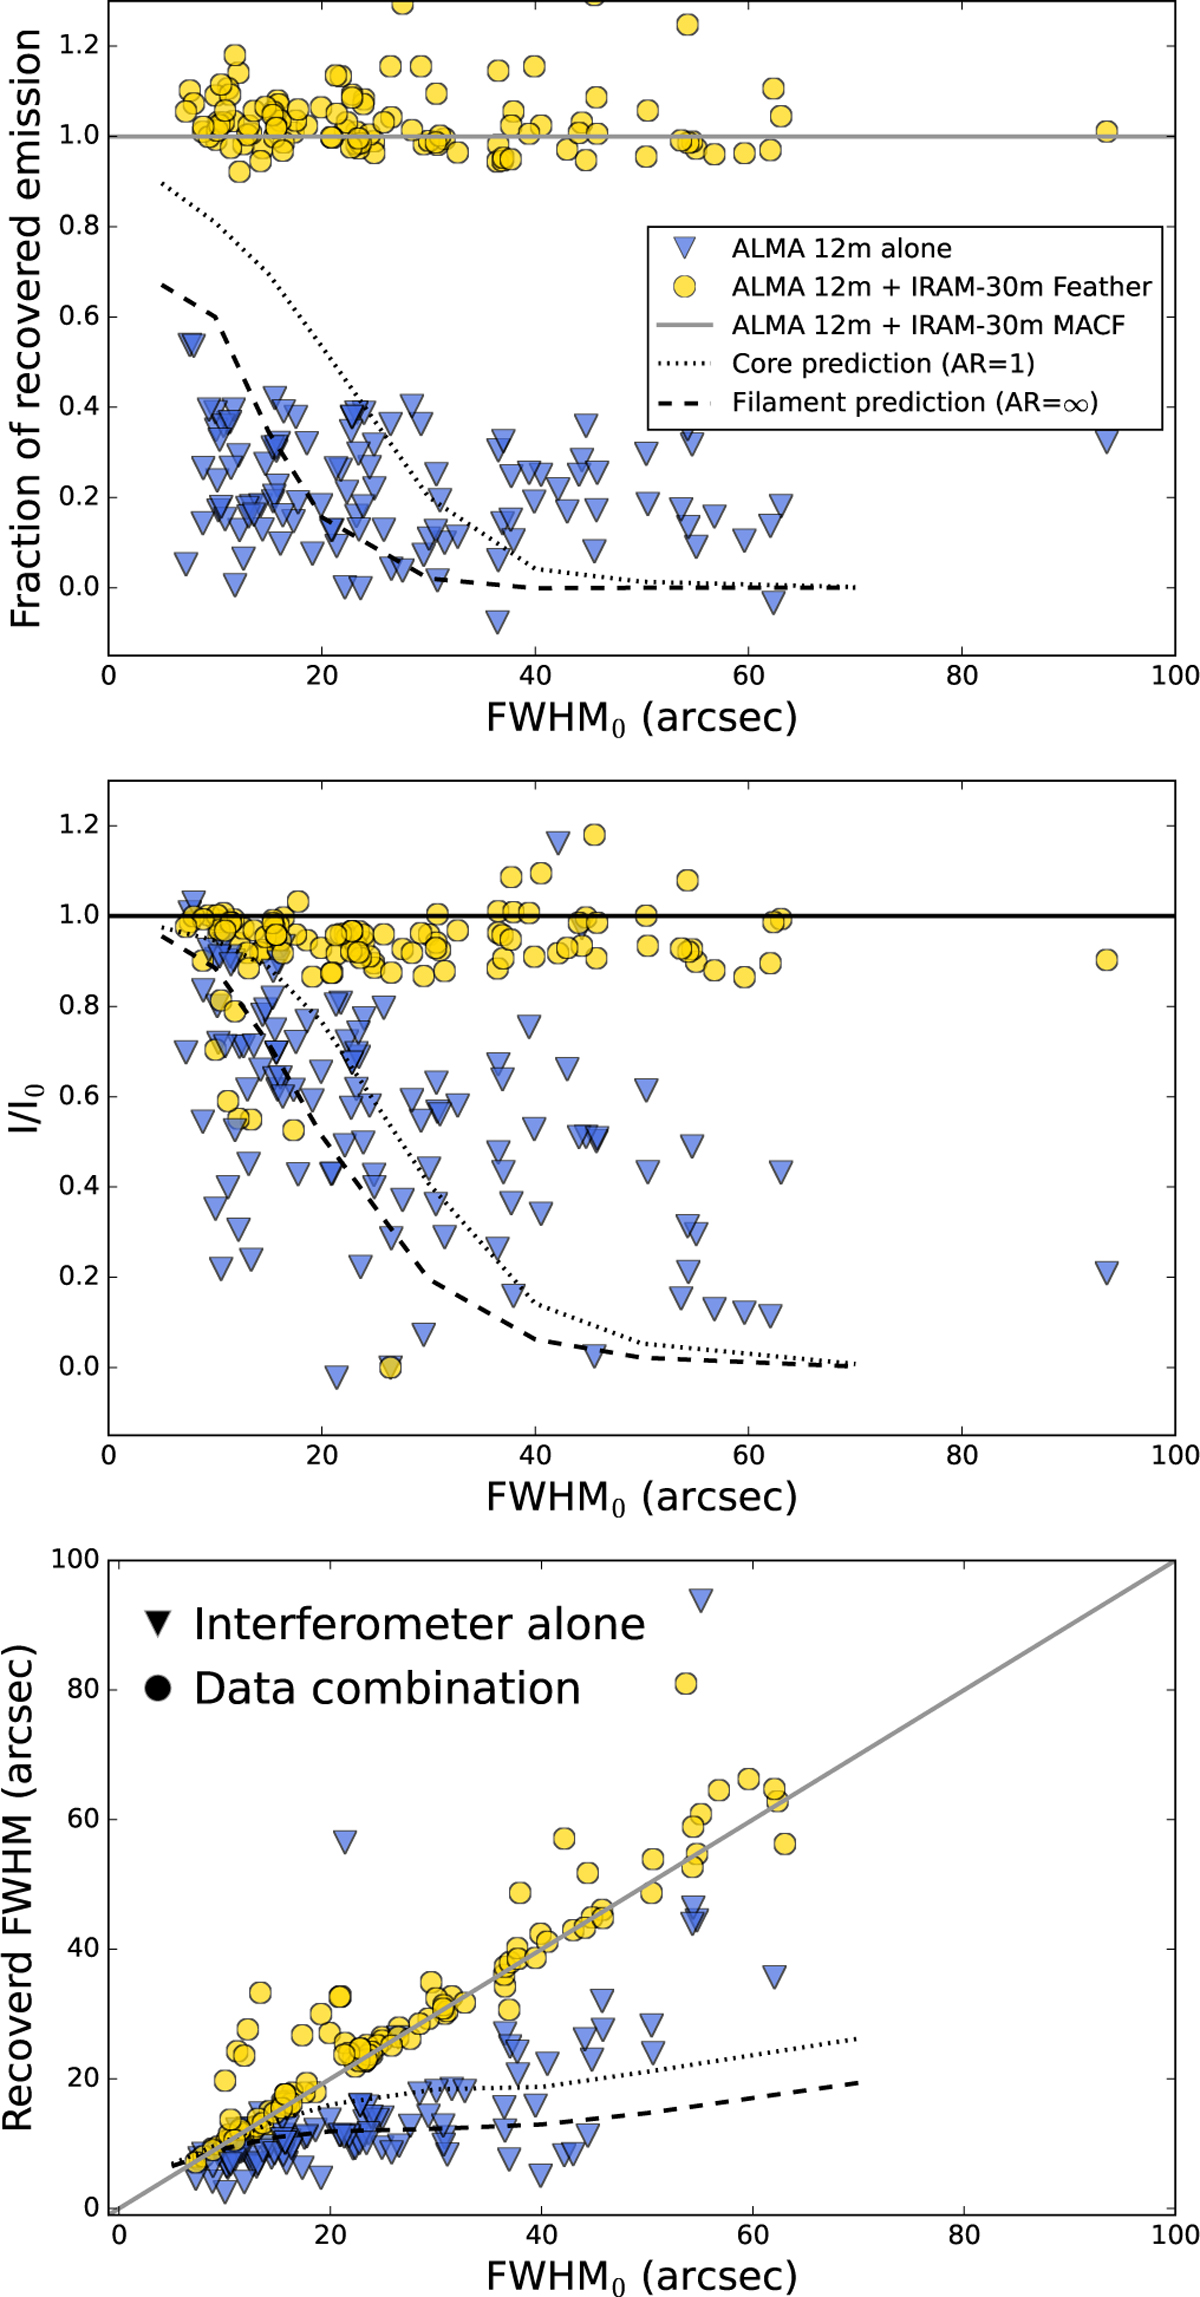
Properties of real filaments (total flux, peak flux, and FWHM) identified in the N2H+ (1−0) integrated intensity maps of OMC-3 (see Fig. 17). All panels display the values obtained from the ALMA 12m-alone (yellow dots) and ALMA 12m+ IRAM-30m Feather (blue triangles) compared to those obtained form the combination of the ALMA 12 m array + IRAM-30 m using the MACF (flux, I0, and FWHMo) method assumed as reference. A perfect agreement between these methods is indicated by a grey line. Predictions form simulations are displayed by the grey dashed line. From top to bottom: Percentage of emission recovered along the entire radial profile; intensity peak FWHM estimated from the Gaussian fit; and FWHM estimated from the Gaussian fit. In all cases, the values are represented as function of the reference filament FWHM0 derived from the ALMA 12 m array + IRAM-30 m MACF map.
Current usage metrics show cumulative count of Article Views (full-text article views including HTML views, PDF and ePub downloads, according to the available data) and Abstracts Views on Vision4Press platform.
Data correspond to usage on the plateform after 2015. The current usage metrics is available 48-96 hours after online publication and is updated daily on week days.
Initial download of the metrics may take a while.