Fig. 17
Download original image
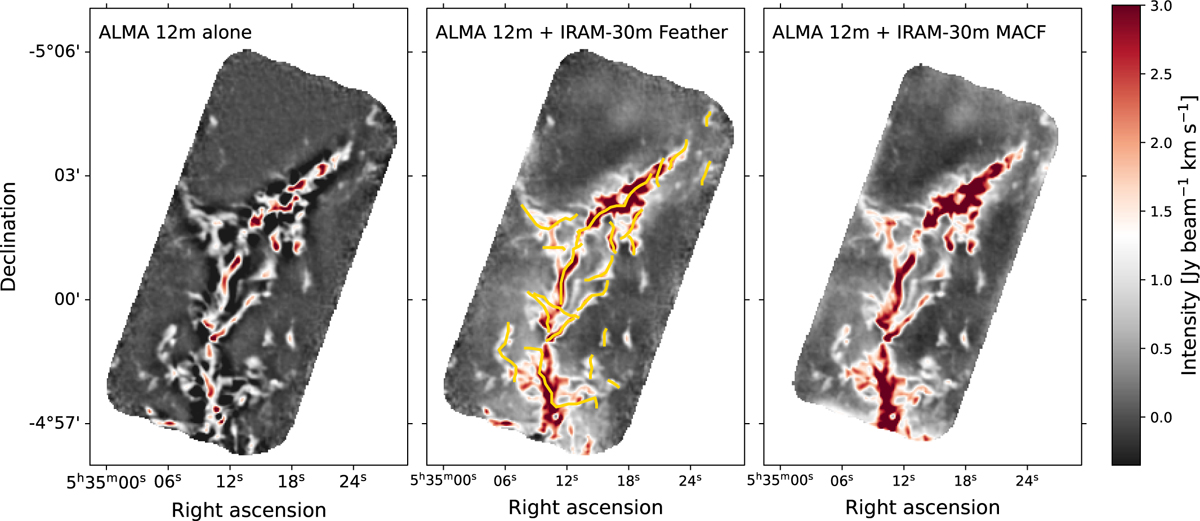
N2H+ (1–0) integrated intensity maps of OMC-3 using three different data combination methods. From left to right: ALMA 12m-alone map; ALMA 12 m array + IRAM-30 m combined using the Feather with the identified filament axes over-plotted (yellow; see also Paper III); and ALMA 12 m array + IRAM-30 m combined using the MACF method.
Current usage metrics show cumulative count of Article Views (full-text article views including HTML views, PDF and ePub downloads, according to the available data) and Abstracts Views on Vision4Press platform.
Data correspond to usage on the plateform after 2015. The current usage metrics is available 48-96 hours after online publication and is updated daily on week days.
Initial download of the metrics may take a while.