Open Access
Fig. 14
Download original image
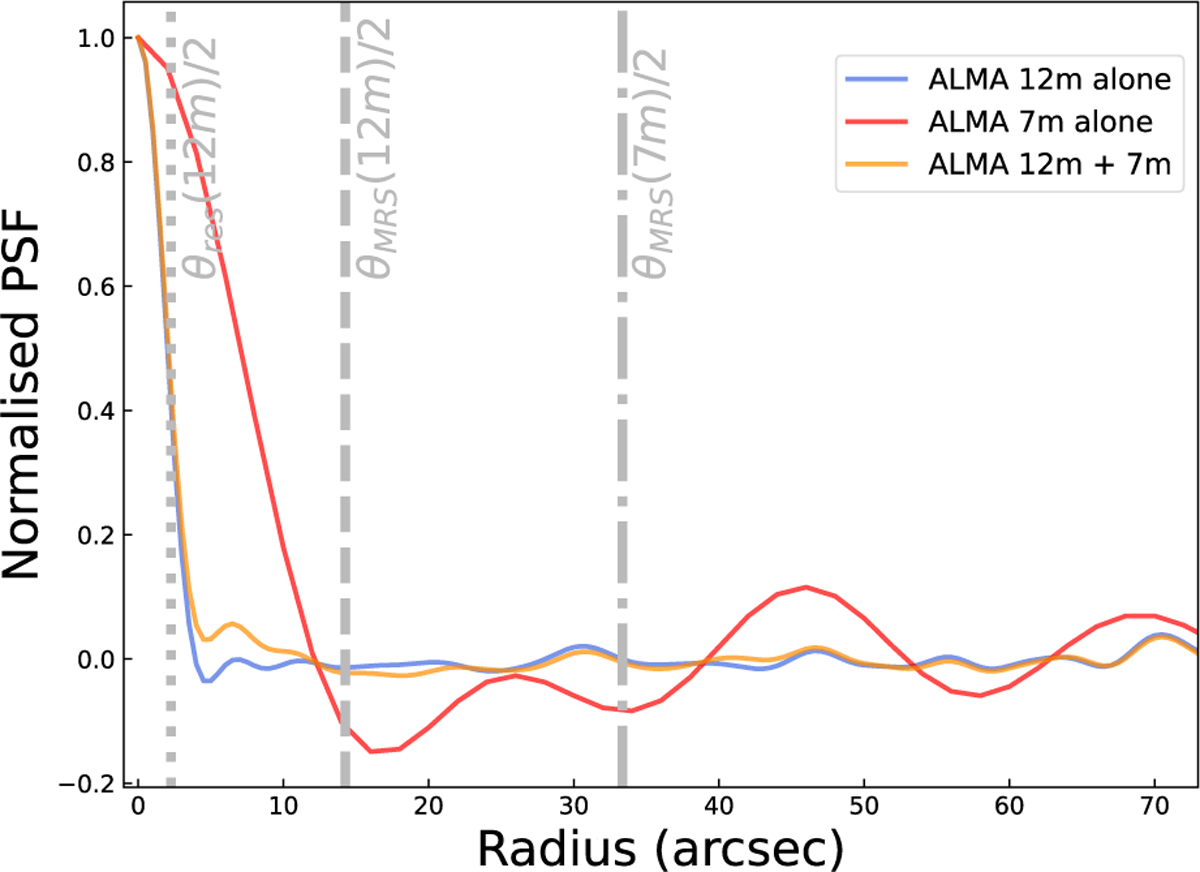
Comparison of the interferometer PSF intensity profile extracted from an horizontal cut for the ALMA 12 m-alone (blue), 7 m-alone (red) and 12m + 7 m (orange). The resolution of the 12 m array (dotted line), and the MRS of both the 12 m (dashed line) and 7 m (dot-dashed line) arrays are indicated by vertical lines.
Current usage metrics show cumulative count of Article Views (full-text article views including HTML views, PDF and ePub downloads, according to the available data) and Abstracts Views on Vision4Press platform.
Data correspond to usage on the plateform after 2015. The current usage metrics is available 48-96 hours after online publication and is updated daily on week days.
Initial download of the metrics may take a while.