Fig. 13
Download original image
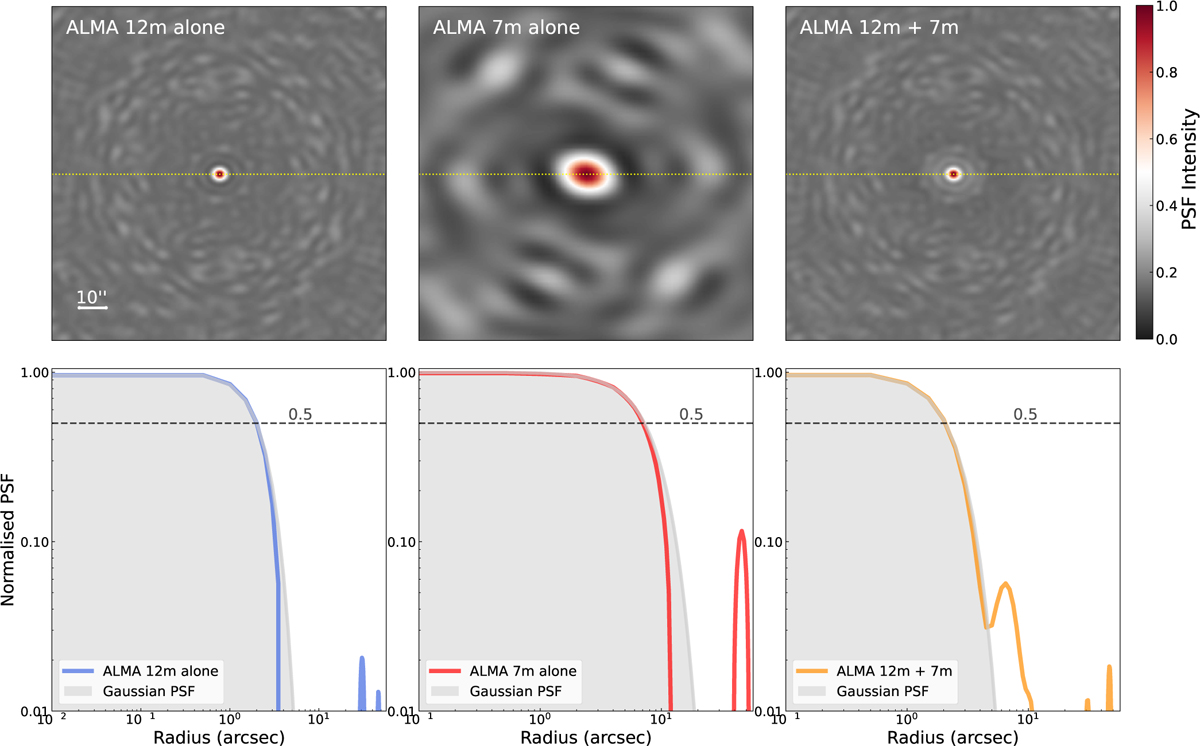
Analysis of the interferometer PSF of different ALMA array configurations. From left to right: ALMA 12 m-alone , 7 m-alone, and ALMA 12 m + 7 m. We display the PSF intensity image for each simulation (top) and an intensity profile extracted along a horizontal cut in log-scale (bottom). In the bottom panels, the colored lines show the simulated PSF profiles (see dotted yellow lines in mid-panels) obtained for the ALMA 12 m-alone (blue), 7 m-alone (red) and 12 m + 7 m (orange), while the expected Gaussian PSF profile at the correspondent resolution is marked by the shaded grey area.
Current usage metrics show cumulative count of Article Views (full-text article views including HTML views, PDF and ePub downloads, according to the available data) and Abstracts Views on Vision4Press platform.
Data correspond to usage on the plateform after 2015. The current usage metrics is available 48-96 hours after online publication and is updated daily on week days.
Initial download of the metrics may take a while.