Fig. 12
Download original image
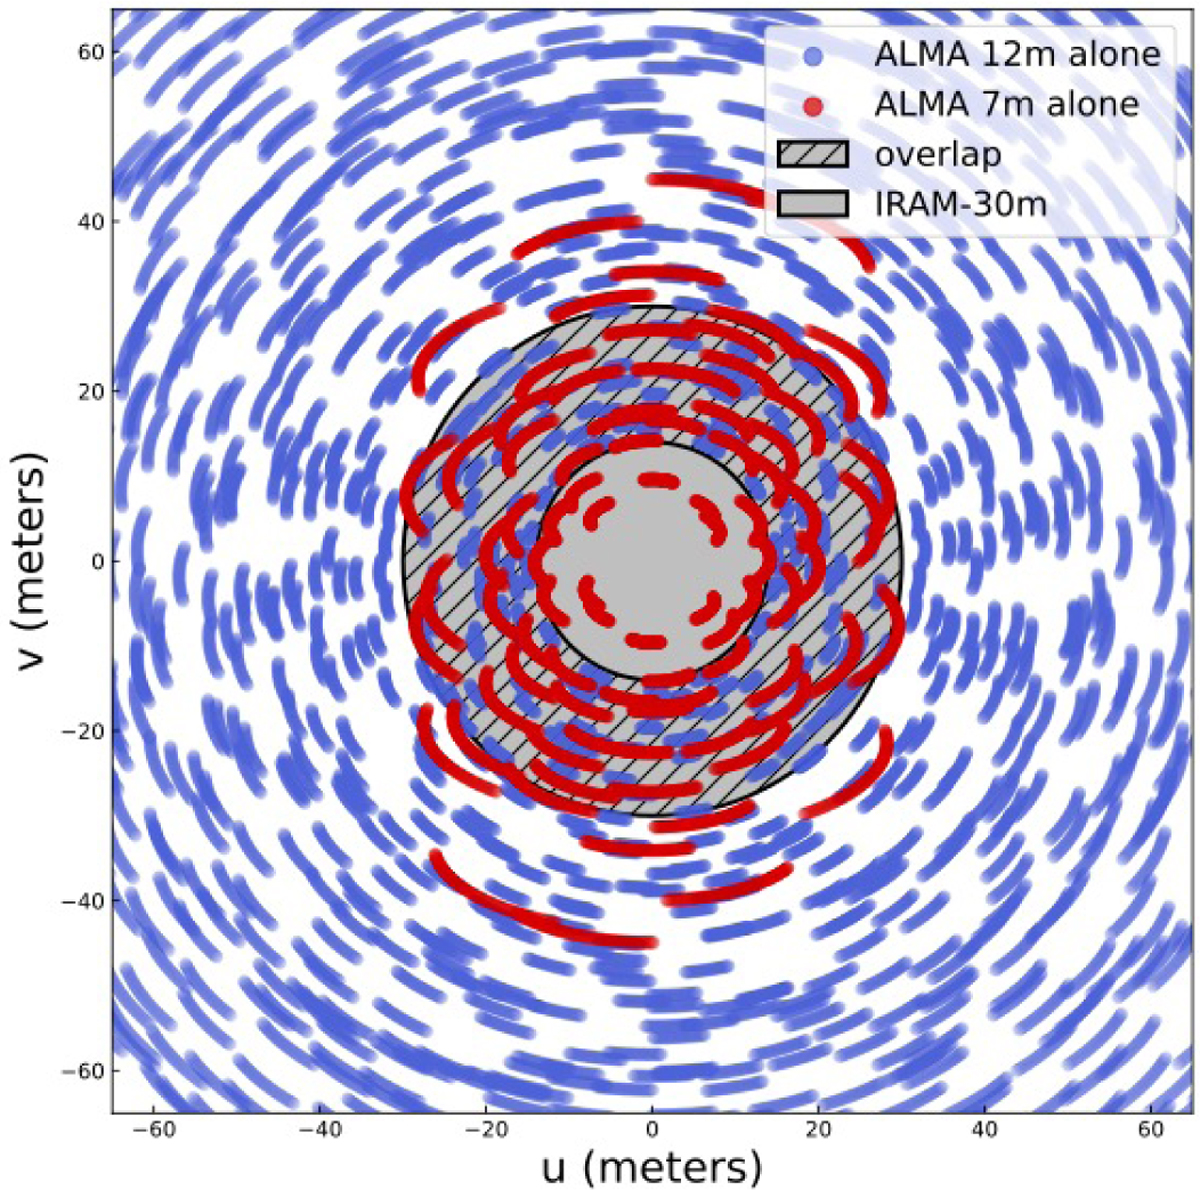
uv-coverage of one of the cores simulated in Sect. 3. Different colors represent the uv-sampling obtained by the different ALMA arrays: (blue) ALMA 12 m, (red) ACA 7 m array, and (orange) TP. We also highlight the uv-area covered by the IRAM-30 m SD telescope (grey area) and its overlap with the ALMA 12 m array (black dashed area).
Current usage metrics show cumulative count of Article Views (full-text article views including HTML views, PDF and ePub downloads, according to the available data) and Abstracts Views on Vision4Press platform.
Data correspond to usage on the plateform after 2015. The current usage metrics is available 48-96 hours after online publication and is updated daily on week days.
Initial download of the metrics may take a while.