Fig. 11
Download original image
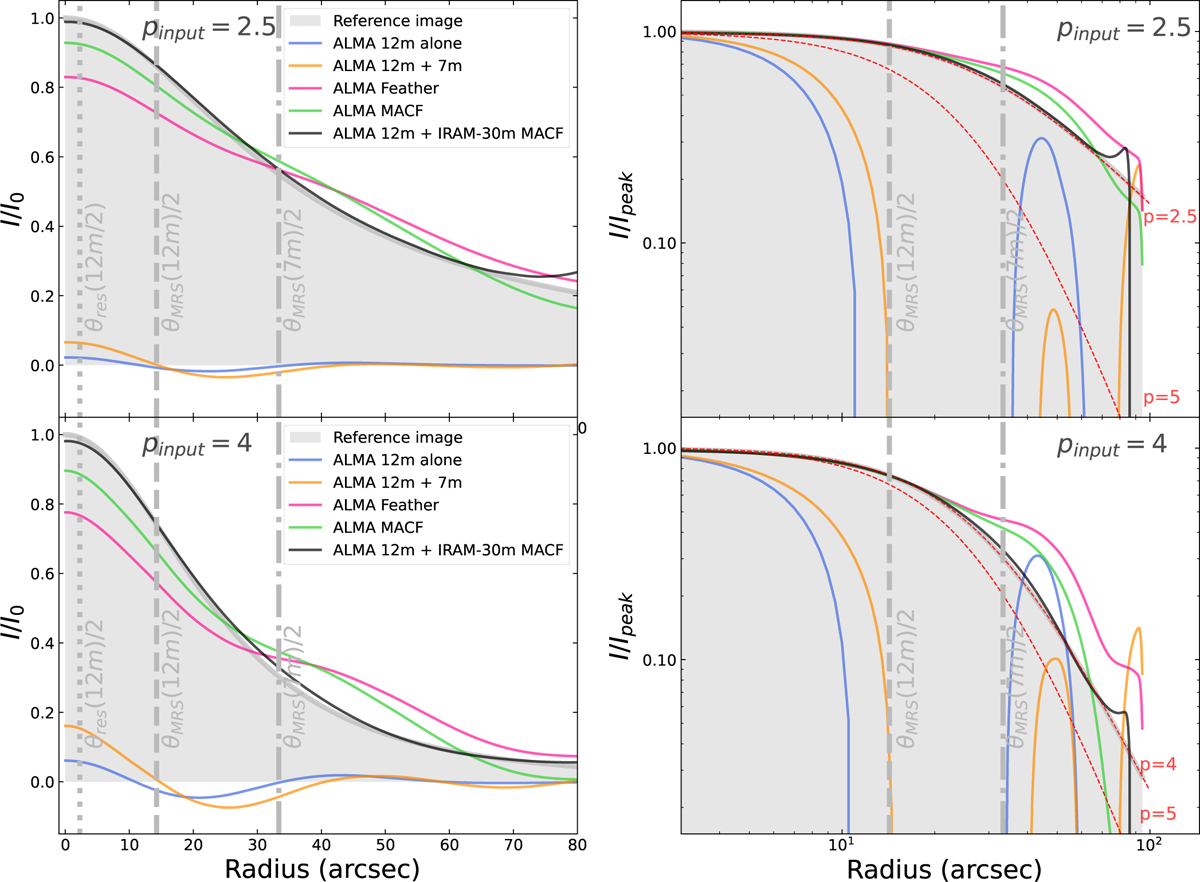
Radial profile extracted through a horizontal cut in the center of a p = 2.5 (top panels) and p = 4 (bottom) Rflat = 30 arcsec Plummer profile. Left: profile is normalized with respect to the reference peak and displayed in normal scale. Right: profile normalized with respect to its peak value displayed in log-scale. The data combination methods use are marked in different colors: ALMA 12 m-alone (blue), ALMA 12 m + 7 m (orange), ALMA Feather (pink), ALMA MACF (green), and ALMA 12 m + IRAM-30 m MACF (black). The reference profile is marked by the gray shadowed area and ideal profiles for different p-values are displayed by red dashed lines.
Current usage metrics show cumulative count of Article Views (full-text article views including HTML views, PDF and ePub downloads, according to the available data) and Abstracts Views on Vision4Press platform.
Data correspond to usage on the plateform after 2015. The current usage metrics is available 48-96 hours after online publication and is updated daily on week days.
Initial download of the metrics may take a while.