Fig. 1
Download original image
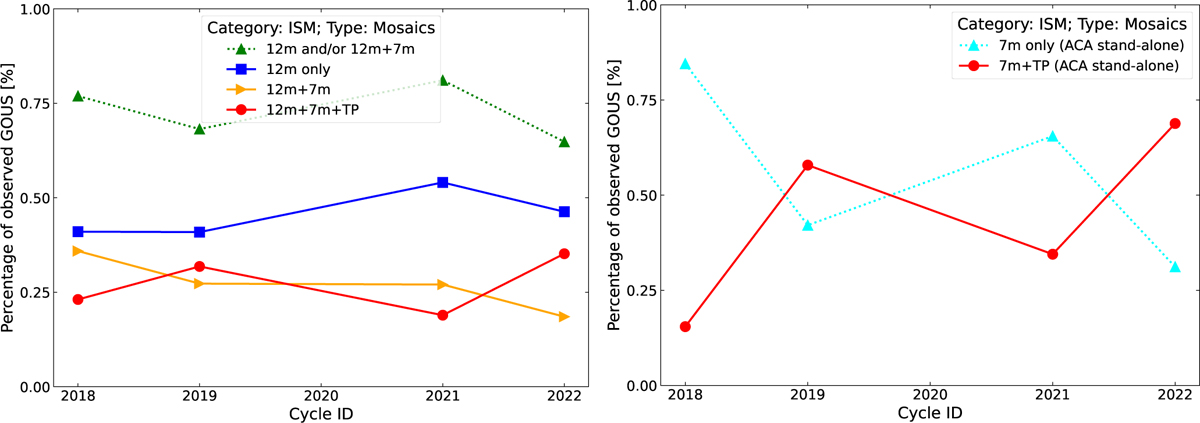
Observed GOUS with ALMA mosaics for the ISM category over ALMA Cycles 6-9 (years 2018-2022). Left panel: percentage of GOUS observed with ALMA obtained with the 12 m (blue squares), 12 m + 7 m (orange triangles), and the 12 m + 7 m + TP (red circles) arrays, respectively. The green triangles represents all the GOUS requested without SD observations (i.e., 12 m and/or 12 m+7 m). Right panel: percentage of GOUS observed with ACA in standalone mode including 7 m-only (cyan triangles) and 7 m+TP data (red circles). Fluctuation of 10–20% are expected from Poisson statistics given the typical number of GOUS considered per cycle (~40 per year).
Current usage metrics show cumulative count of Article Views (full-text article views including HTML views, PDF and ePub downloads, according to the available data) and Abstracts Views on Vision4Press platform.
Data correspond to usage on the plateform after 2015. The current usage metrics is available 48-96 hours after online publication and is updated daily on week days.
Initial download of the metrics may take a while.