Fig. 9.
Download original image
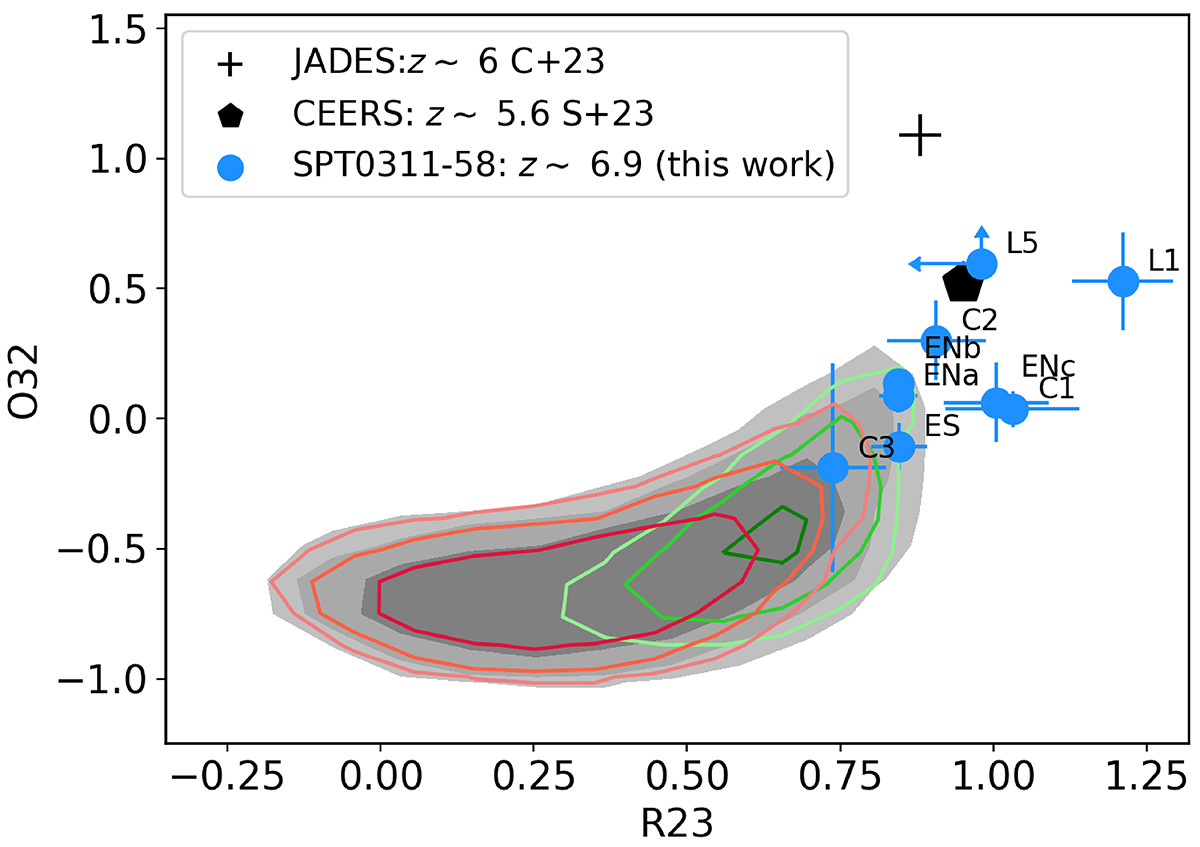
R23 – O32 diagnostic diagram. The blue dots represent the galaxies in SPT0311–58 and are based on R2700 fluxes (except when the line was only detected in R100). They are corrected for attenuation and aperture. Grey-shaded regions show the zones covered by 80, 90, and 99 percent of the local SDSS sample of star forming galaxies (York et al. 2000; Abazajian et al. 2009). Green and red isocontours correspond to mass ranges log(M⋆/M⊙) = [8.5–9.5] and [9.5–10.5], respectively. The black symbols are for stacked spectra of other high-z samples observed with JWST/NIRSpec, as indicated by the labels (C+23: Cameron et al. 2023; S+23: Sanders et al. 2024).
Current usage metrics show cumulative count of Article Views (full-text article views including HTML views, PDF and ePub downloads, according to the available data) and Abstracts Views on Vision4Press platform.
Data correspond to usage on the plateform after 2015. The current usage metrics is available 48-96 hours after online publication and is updated daily on week days.
Initial download of the metrics may take a while.