Fig. 8.

Download original image
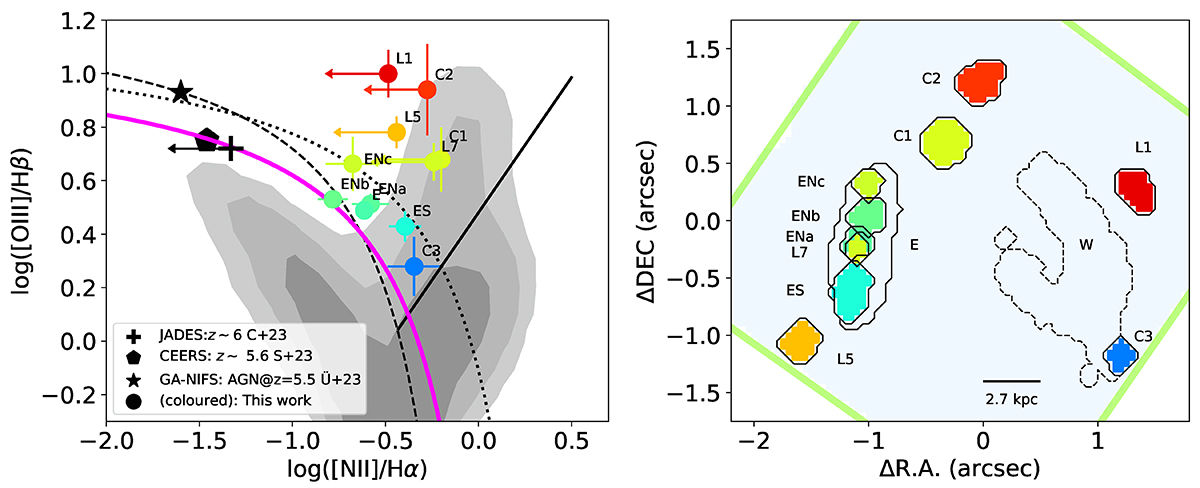
Classical N2-BPT diagram and ionization map for the z ∼ 6.9 sources in SPT0311–58. Left: BPT diagram colour coded according to the [OIII]λ5007/Hβ value. The line ratios are derived from the integrated R2700 spectra, and include the subregions within E and the five external z ∼ 6.9 sources with reliable line fluxes. Upper limits correspond to 3σ. Grey-shaded regions show the zones of the diagram covered by 70, 80, and 90 percent of the local SDSS sample of star forming galaxies and AGN. (York et al. 2000; Abazajian et al. 2009). Below the dashed line, local galaxies are ionised by SF (Kauffmann et al. 2003), while above the dotted line the presence of AGN is required (Kewley et al. 2001). The region beneath the black solid line corresponds to LI(N)ERs (Cid Fernandes et al. 2010). The magenta line is the locus of z ∼ 2–3 star-forming galaxies found by Strom et al. (2017). The black symbols correspond to other galaxies at z > 5 observed with JWST/NIRSpec (C+23: Cameron et al. 2023; S+23: Sanders et al. 2024; Ü+23: Übler et al. 2023). Right: Spatial distribution of the different galaxies in the SPT0311–58 system. The apertures used (Appendix A.1) are colour coded according to their [OIII]λ5007/Hβ values, as in the left panel.
Current usage metrics show cumulative count of Article Views (full-text article views including HTML views, PDF and ePub downloads, according to the available data) and Abstracts Views on Vision4Press platform.
Data correspond to usage on the plateform after 2015. The current usage metrics is available 48-96 hours after online publication and is updated daily on week days.
Initial download of the metrics may take a while.


