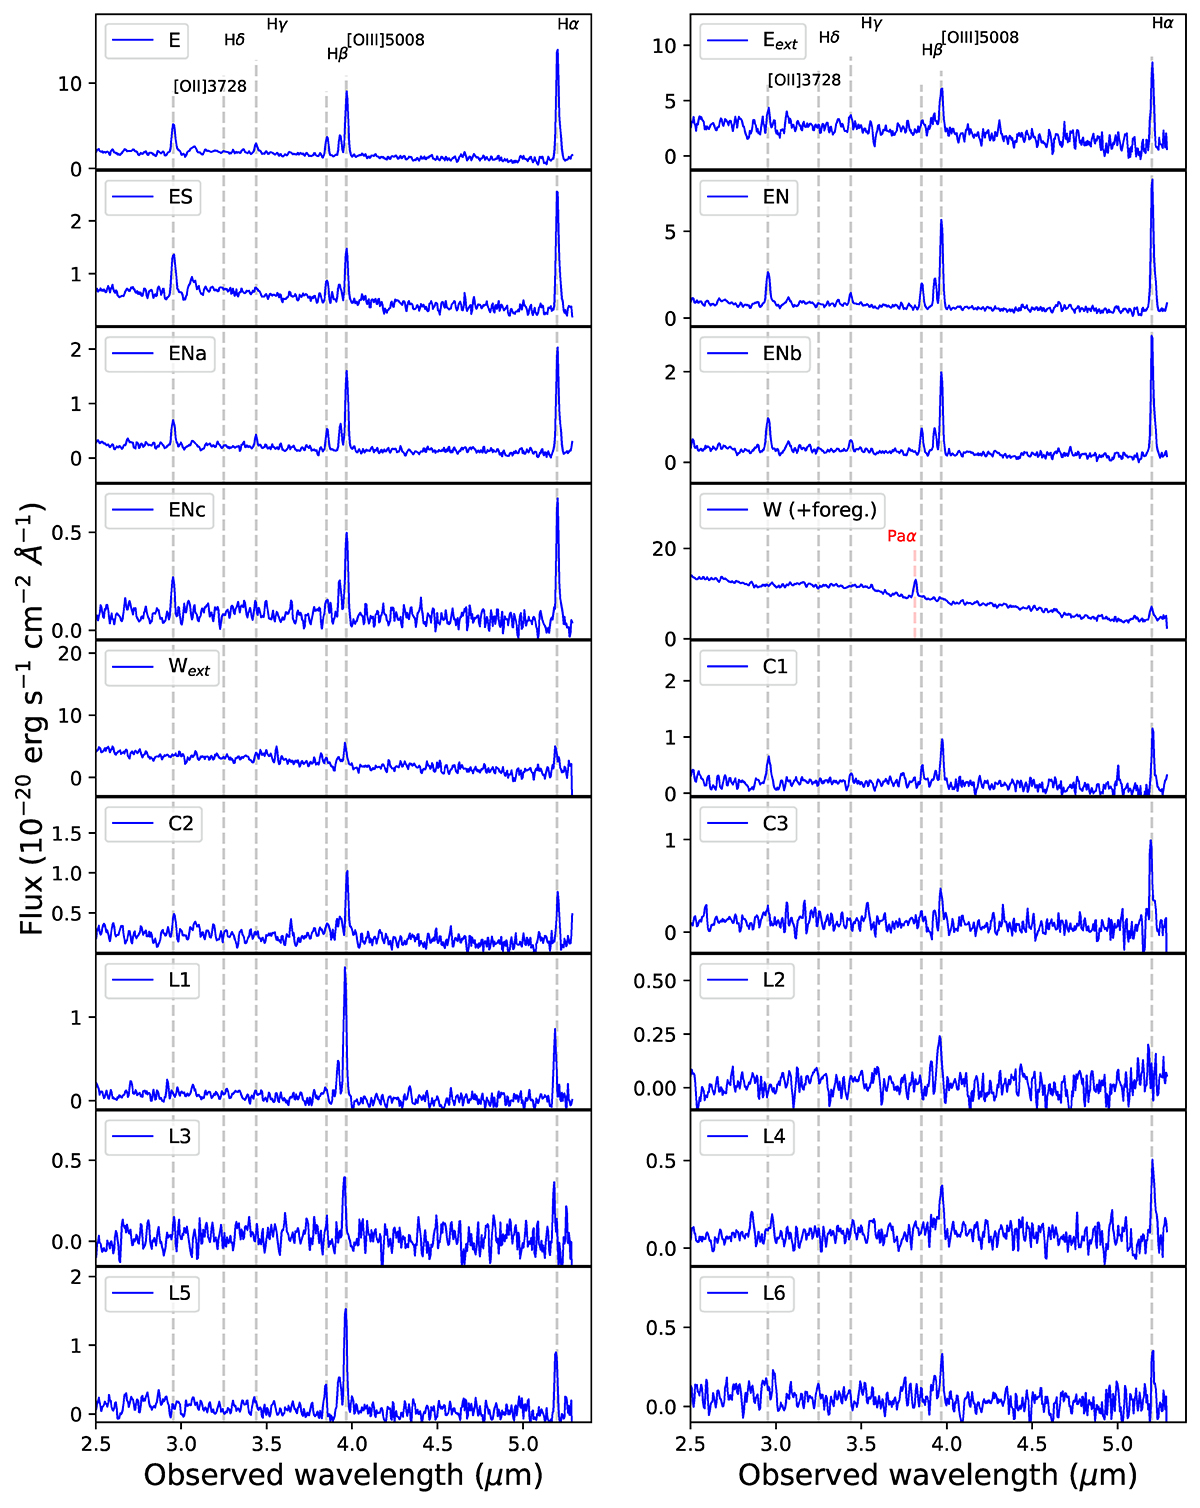
Fig. 5.
Download original image
R100 spectra for the different z ∼ 6.9 sources and regions identified in the spectral images presented in Fig. 2. The apertures used are shown in Fig. 3, and further details in Appendix A. The W spectrum is contaminated by the foreground lens galaxy continuum and Paα line (marked in red), which is close to Hβ of W (see the lens spectrum in Fig. 4). The black vertical dashed lines mark the expected position of the corresponding lines for a z ∼ 6.92.
Current usage metrics show cumulative count of Article Views (full-text article views including HTML views, PDF and ePub downloads, according to the available data) and Abstracts Views on Vision4Press platform.
Data correspond to usage on the plateform after 2015. The current usage metrics is available 48-96 hours after online publication and is updated daily on week days.
Initial download of the metrics may take a while.