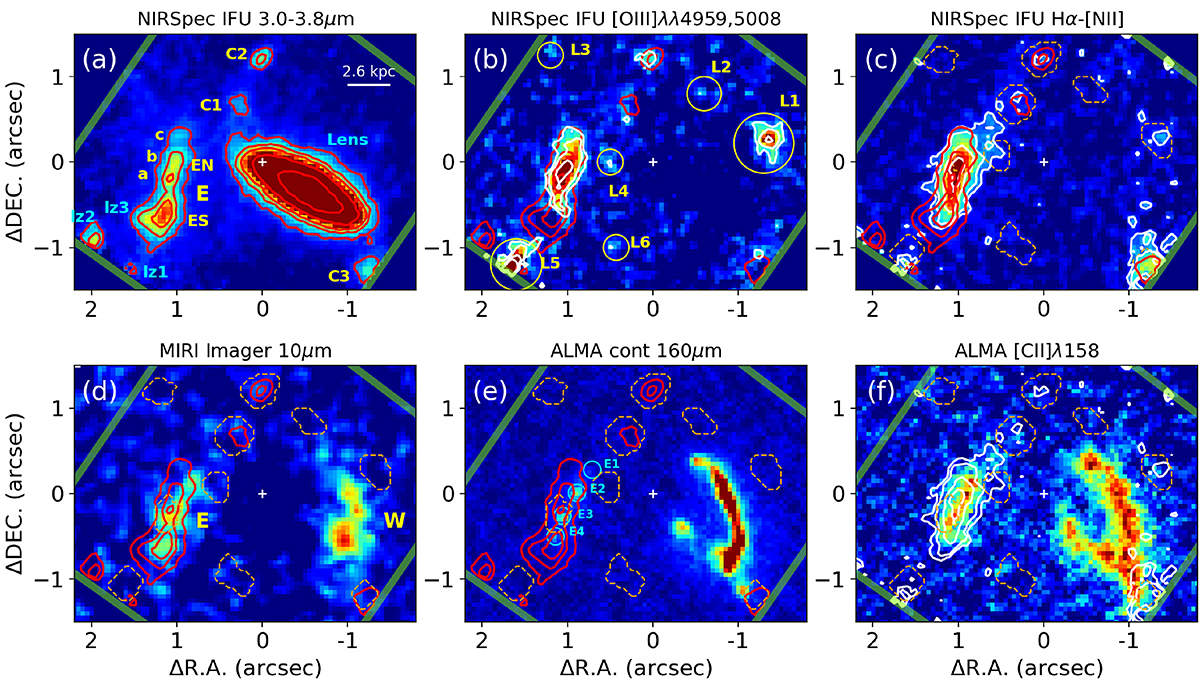
Fig. 2.
Download original image
Continuum and line emission NIRSpec IFU images, together with MIRI and ALMA data. (a): NIRSpec image generated by collapsing the R100 datacube in the 3.0–3.8 μm spectral range (see text). The continuum emitting sources, whose spectra indicate they are at z ∼ 6.9, are identified with yellow labels (i.e. C1, C2, C3, E). In the E galaxy, we distinguish several subregions (ES, ENa,b,c). Sources that according to their spectra are at lower z (i.e. lz1, lz2, lz3) are labelled in cyan, along with the foreground lens galaxy. The red isocontours (in red) correspond to 5, 10, 15, 30, and 100σ values. (b): [OIII] emission image at z ∼ 6.9 obtained from the R100 datacube (see text for specific spectral ranges). Six line-emitting sources that were not detected in the continuum map (panel a), are identified in this map as z ∼ 6.9 sources and labelled in yellow (L1 to L6). White isolines correspond to 3, 5, 10, and 15σ. Here, and in panels (c), (d), and (e), the red contours are the same as in panel (a), after removing the ones for the lens galaxy for clarity. (c): Same as panel (b) but for the Hα emission. (d): MIRI image at 10 μm, after subtracting the lens (Álvarez-Márquez et al. 2023). (e): ALMA continuum at 160 μm. We mark clumps E1 – E4 identified by Spilker et al. (2022). (f): ALMA map of the [CII]λ158 line. The white isolines correspond to the Hα emission. Figure 3 identify the targets and their apertures (for details see Appendix A). In panels (c-f), these apertures are also shown with orange dashed lines. The green straight lines in all the pannels indicate the border of the NIRSpec IFU FoV.
Current usage metrics show cumulative count of Article Views (full-text article views including HTML views, PDF and ePub downloads, according to the available data) and Abstracts Views on Vision4Press platform.
Data correspond to usage on the plateform after 2015. The current usage metrics is available 48-96 hours after online publication and is updated daily on week days.
Initial download of the metrics may take a while.