Open Access
Fig. A.3.
Download original image
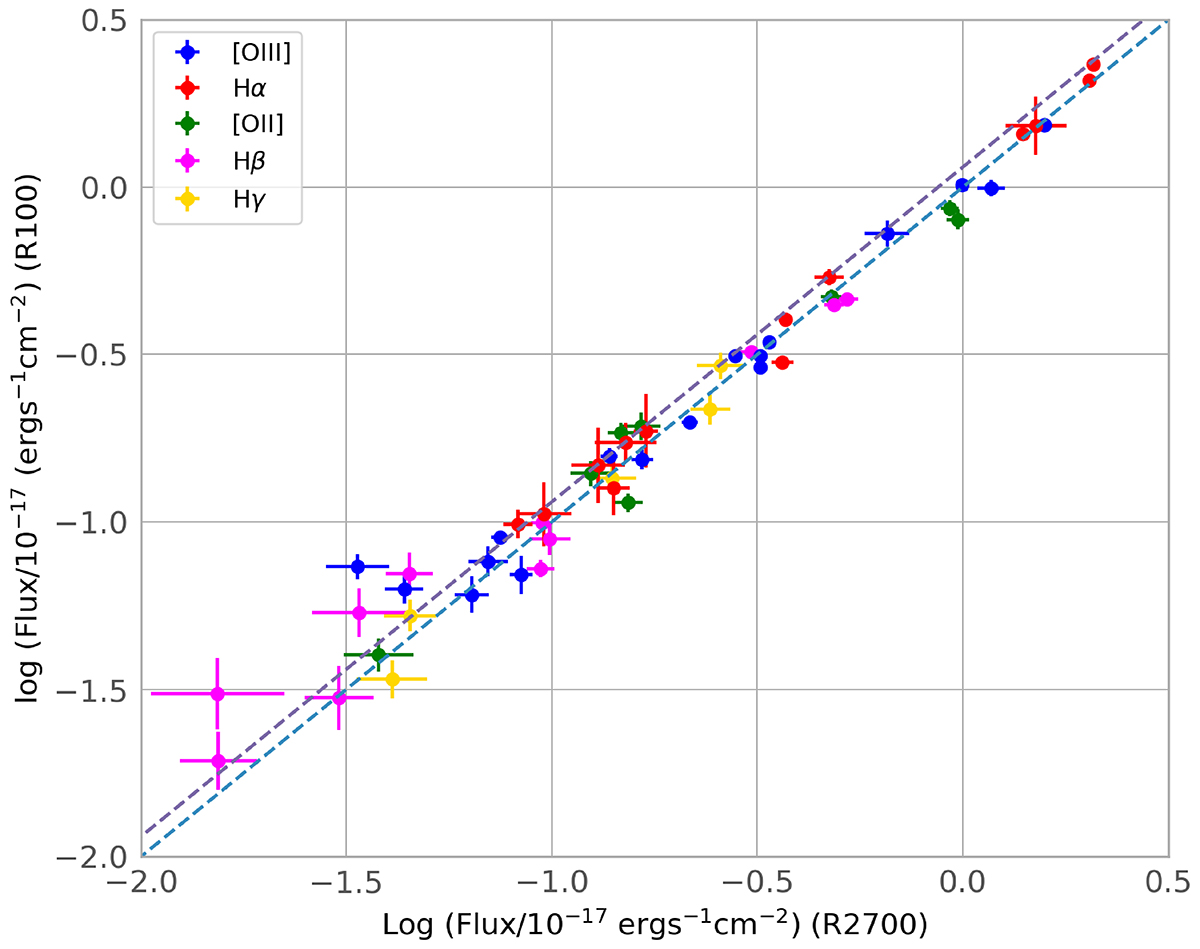
Comparison of the line fluxes obtained from R100 and R2700 integrated spectra. Fluxes from R100 spectra are reduced by 10 percent (see text). The dashed lines correspond to the 1:1 and 1:1.1 ratios. Colours distinguish between lines, and green text labels indicate the aperture/spectrum.
Current usage metrics show cumulative count of Article Views (full-text article views including HTML views, PDF and ePub downloads, according to the available data) and Abstracts Views on Vision4Press platform.
Data correspond to usage on the plateform after 2015. The current usage metrics is available 48-96 hours after online publication and is updated daily on week days.
Initial download of the metrics may take a while.