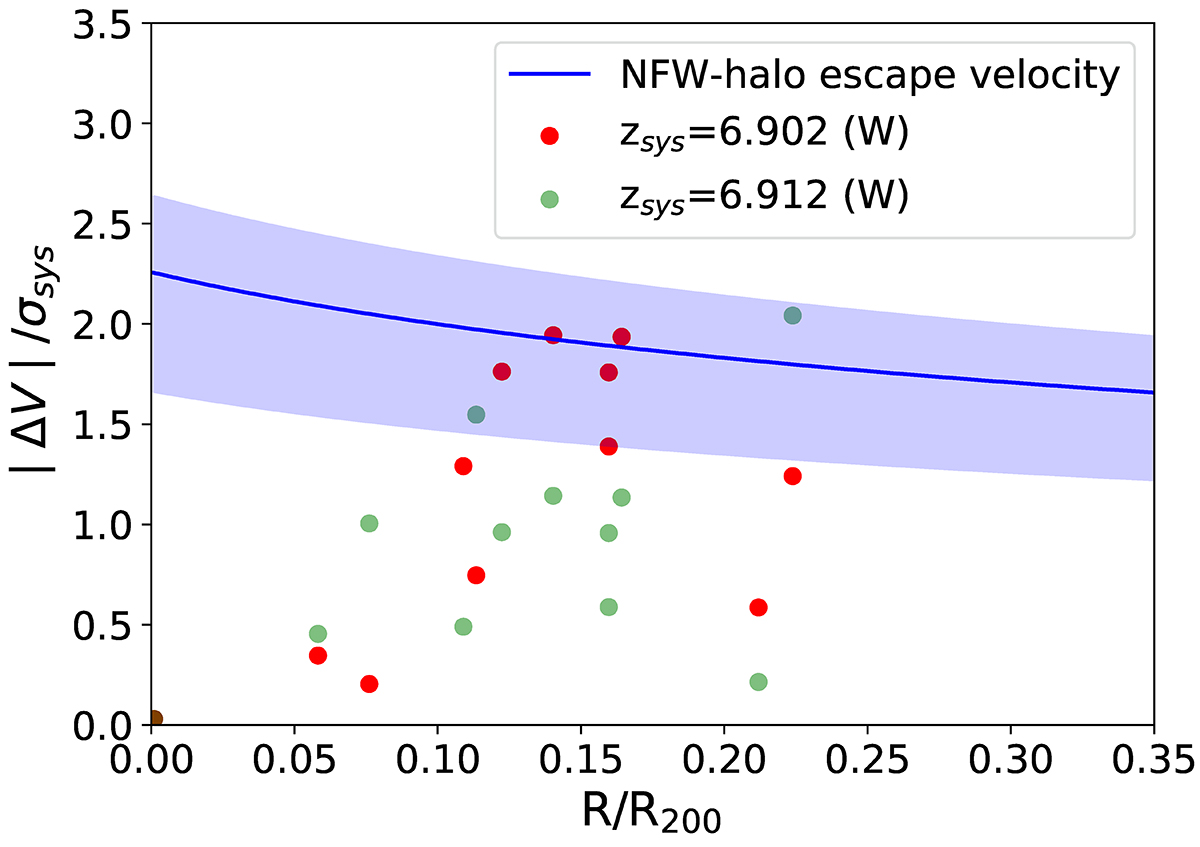
Fig. 13.
Download original image
Projected phase space for the galaxies in SPT0311–58. The x-axis is the projected distance from the cluster centre in units of R200. The y-axis shows the absolute value of the relative velocity along the line of sight of each galaxy with respect to the global recessional velocity, normalised by the velocity dispersion of the cluster. The red dots correspond to a global cluster redshift of zsys = 6.902 as inferred for the W galaxy from the [CII] line, and the green dots are for an ad-hoc zsys = 6.912. The blue line represents the escape velocity normalised by the velocity dispersion of the cluster for a Navarro, Frenk, and White dark matter halo (Navarro et al. 1996) of M200 = 5 × 10¹² M⊙, with the blue shadow defining the region for masses between 2 and 8 × 10¹² M⊙. The point for the W galaxy at (0, 0) has been slightly shifted to make it more visible.
Current usage metrics show cumulative count of Article Views (full-text article views including HTML views, PDF and ePub downloads, according to the available data) and Abstracts Views on Vision4Press platform.
Data correspond to usage on the plateform after 2015. The current usage metrics is available 48-96 hours after online publication and is updated daily on week days.
Initial download of the metrics may take a while.