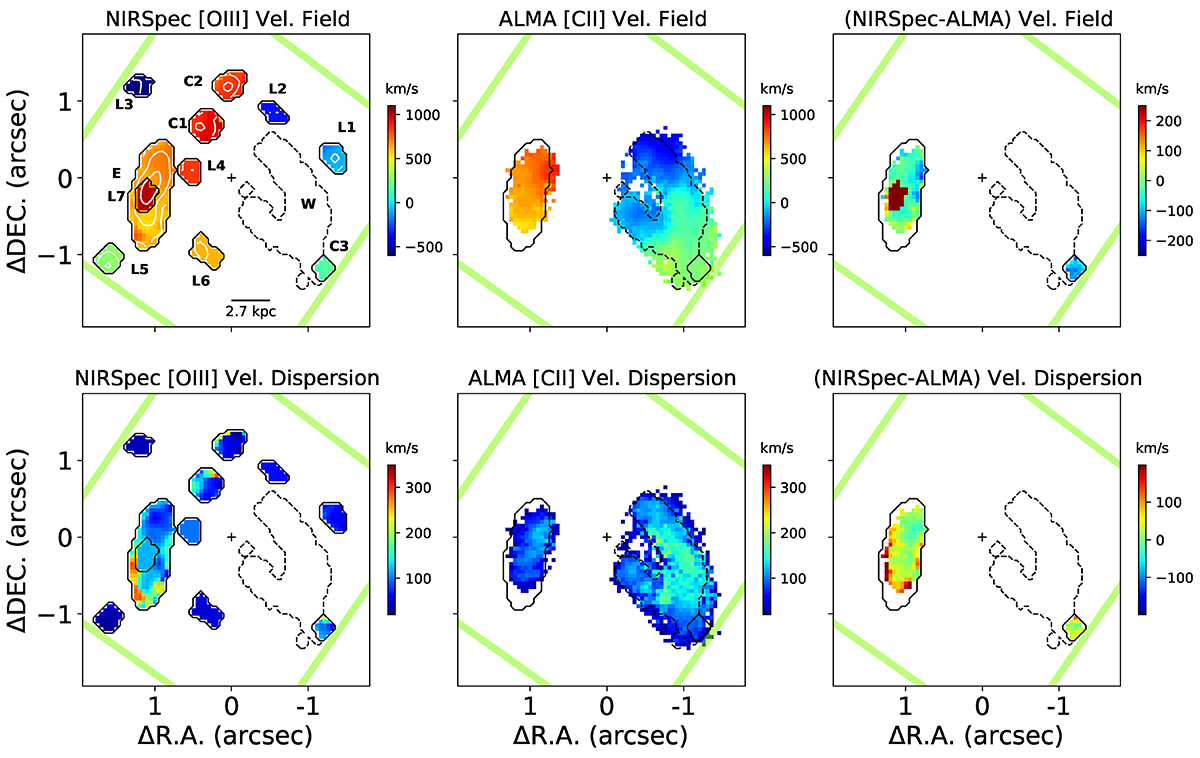
Fig. 11.
Download original image
Kinematic maps of SPT0311–58. Upper panels: large-scale velocity fields from the high resolution NIRSpec IFU spectra in the [OIII]-Hβ complex (left), from the [CII]λ158 line observed with ALMA (centre), and difference (right). Lower panels: similar maps for the intrinsic velocity dispersion (σ0). The NIRSpec maps were obtained after a 3 × 3 spaxel binning, except for L2, L3, L4, L6 and L7 for which, due to their low S/N, the values from the integrated spectrum were assigned to the entire extraction aperture. The values for L7 were obtained after the kinematic decomposition of two overlapping systems (Sect. 3.3.3). The relative velocity values are in km s−1, taking as reference a redshift of 6.902. The NIRSpec velocity dispersions are corrected for the instrumental broadening according to the dispersion curves provided by Jakobsen et al. (2022).
Current usage metrics show cumulative count of Article Views (full-text article views including HTML views, PDF and ePub downloads, according to the available data) and Abstracts Views on Vision4Press platform.
Data correspond to usage on the plateform after 2015. The current usage metrics is available 48-96 hours after online publication and is updated daily on week days.
Initial download of the metrics may take a while.