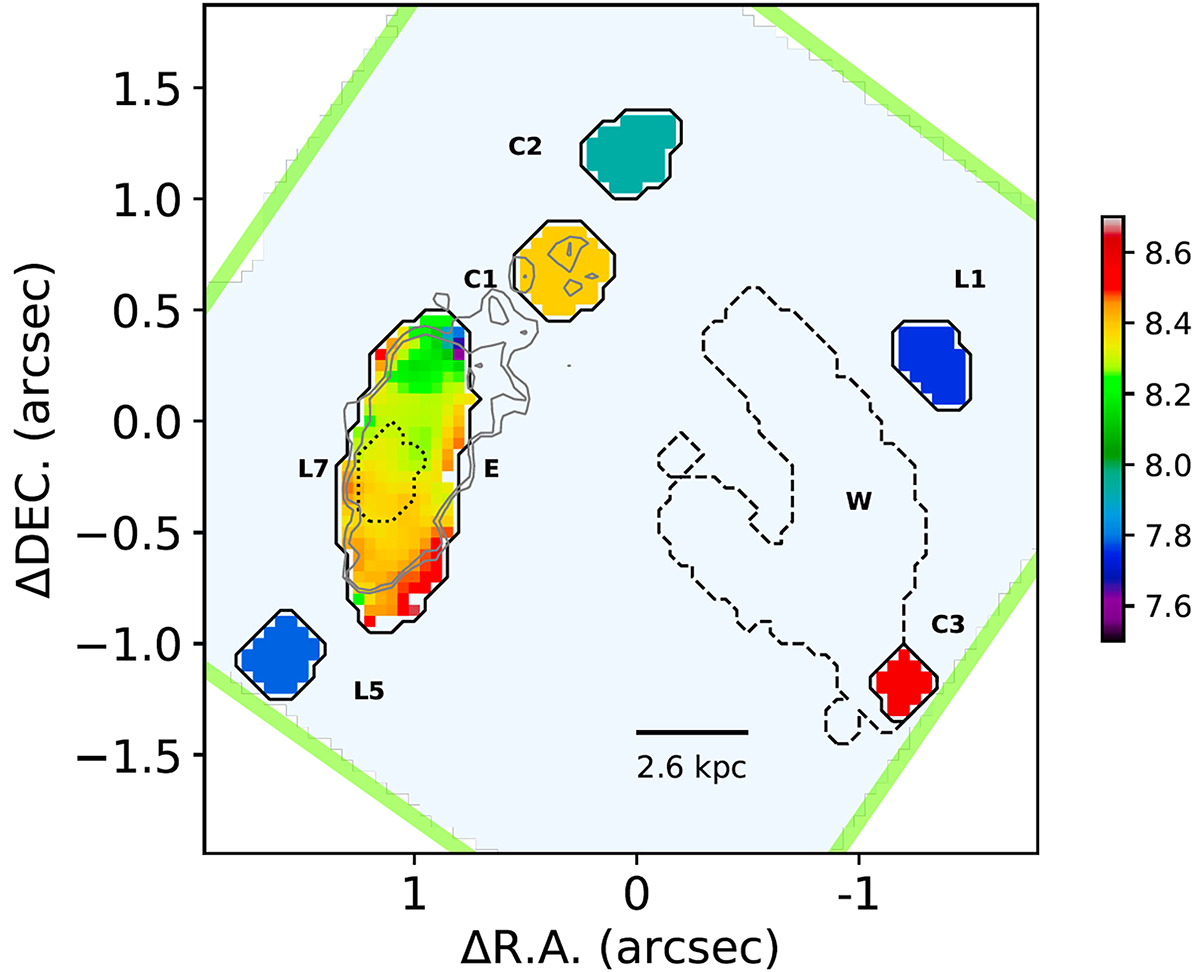
Fig. 10.
Download original image
Metallicity map based on the calibrations of Curti et al. (2017, 2020b) in the 12+(O/H) scale. For the E galaxy, spaxel-by-spaxel information is provided. For the external regions, the value obtained from the integrated spectra is assigned to the entire aperture. The region where the galaxy L7 appears in projection over E, is indicated with a dotted line. The line fluxes were corrected with the mean AV value for the apertures. The faint grey lines correspond to two low-level isocountours of the Hα emission (Fig. 2c) (see text).
Current usage metrics show cumulative count of Article Views (full-text article views including HTML views, PDF and ePub downloads, according to the available data) and Abstracts Views on Vision4Press platform.
Data correspond to usage on the plateform after 2015. The current usage metrics is available 48-96 hours after online publication and is updated daily on week days.
Initial download of the metrics may take a while.