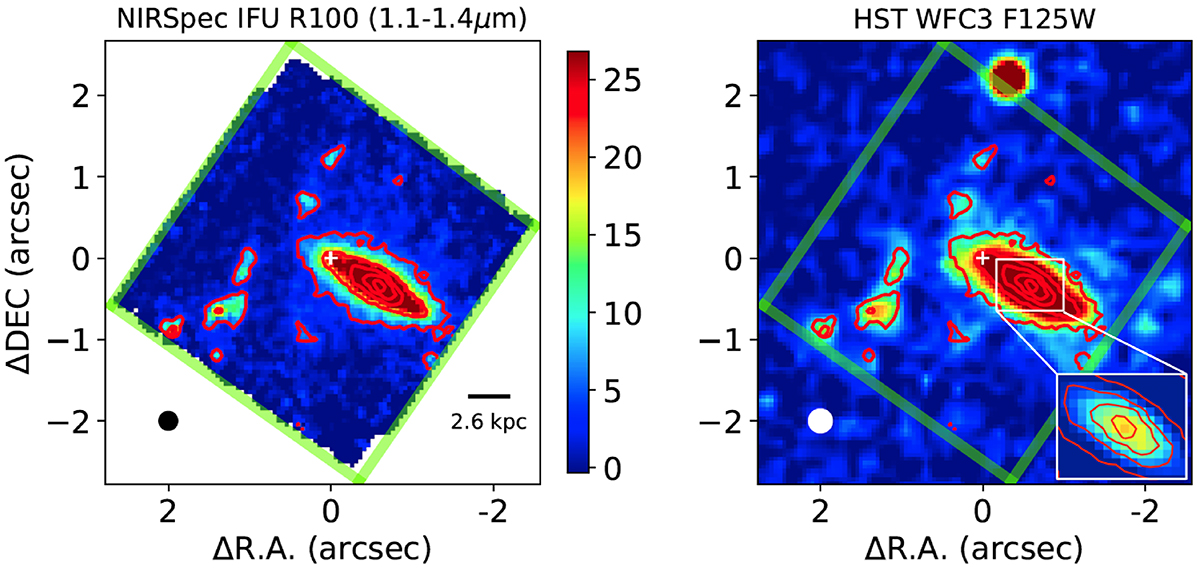
Fig. 1.
Download original image
Comparison of JWST/NIRSpec IFU and HST imaging. Left: Image generated from the NIRSpec R100 datacube, integrating over the spectral range 1.1–1.4 μm. The colour bar is in units of 10−19 erg s−1 cm−2 per spatial pixel. Right: HST image obtained with WFC3 and F125W filter resampled at the pixel size used with NIRSpec (i.e. 0.050″). The inset zooms in on the region around the emission peak used to align the NIRSpec cube (red isophotes) with the image represented with an unsaturated colour code. Here, and in all the spectral maps presented in this work, the (0, 0) corresponds to coordinates α = 03h 11m 33s.248 and δ = −58° 23′33″.24 (white cross). In the image the peak of the lens galaxy is at relative coordinates (−0.64″, −0.29″). The green lines indicate the border of the NIRSpec IFU FoV. The black and white circles in the bottom-left corners of the panels represent the FWHW of the respective PSFs.
Current usage metrics show cumulative count of Article Views (full-text article views including HTML views, PDF and ePub downloads, according to the available data) and Abstracts Views on Vision4Press platform.
Data correspond to usage on the plateform after 2015. The current usage metrics is available 48-96 hours after online publication and is updated daily on week days.
Initial download of the metrics may take a while.