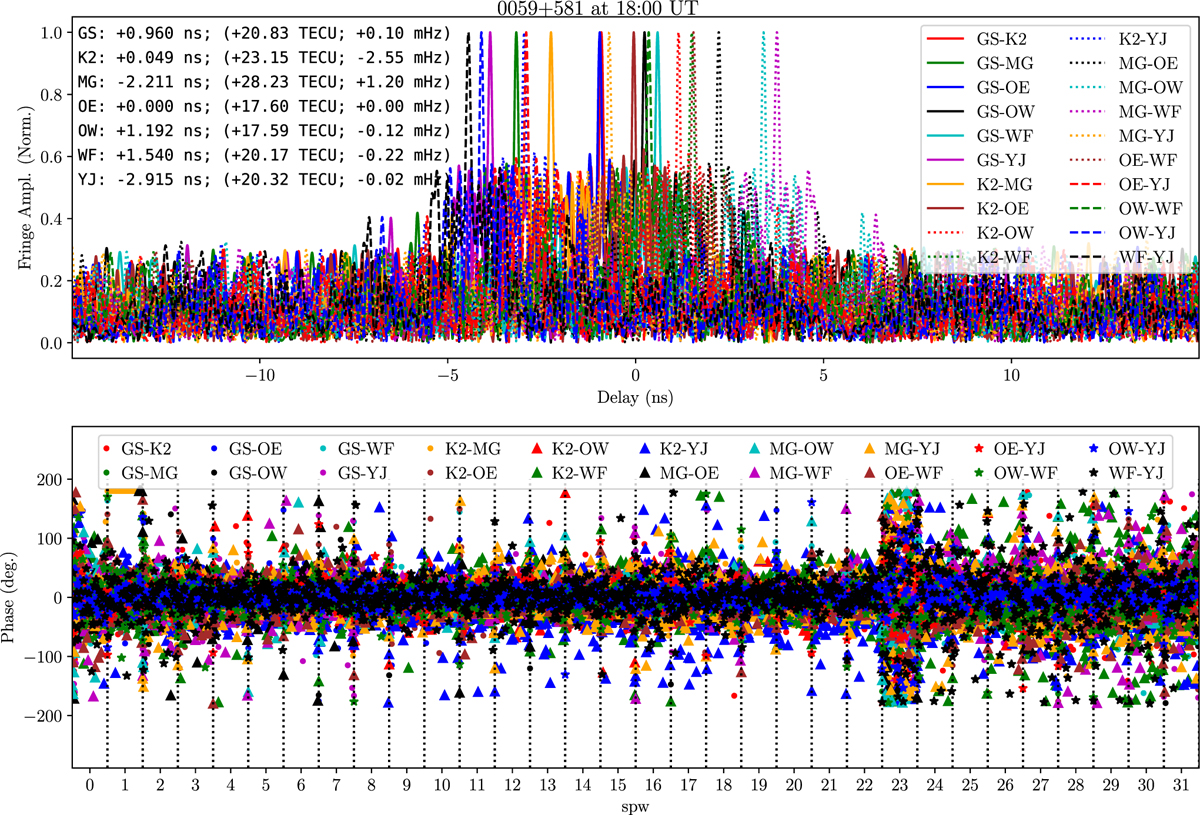
Fig. 6
Download original image
Result of the WBGFF for the first scan of our experiment (taken at 18 UT). Top: fringe amplitudes in delay space after ionospheric dispersion is removed. The values of the antenna-based gains from the GFF are shown in the left panel (TECU is the full ionospheric contribution, including the prior from the IONEX map). The delay values are shown taking OE as the reference antenna. Bottom: visibility phases after the complete fringe calibration, shown as a function of frequency (ordered by spw). The IS antenna did not participate in this scan.
Current usage metrics show cumulative count of Article Views (full-text article views including HTML views, PDF and ePub downloads, according to the available data) and Abstracts Views on Vision4Press platform.
Data correspond to usage on the plateform after 2015. The current usage metrics is available 48-96 hours after online publication and is updated daily on week days.
Initial download of the metrics may take a while.