Fig. 5
Download original image
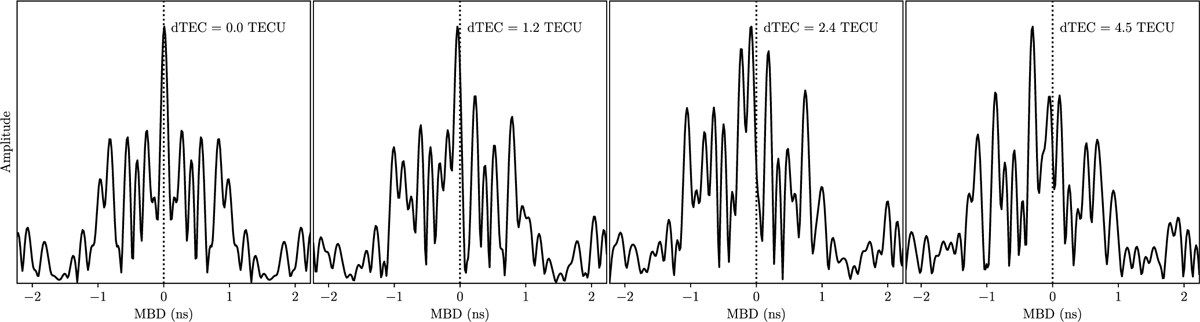
Simulated multiband delay fringes for the VGOS frequency coverage, assuming a point source without noise. Different dTEC values were added to each panel. The fringe peak with null dTEC is marked with a dotted line. The ambiguity introduced for dTEC = 4.5 TECU is clear (i.e., the first sidelobe at the left becomes higher than the main fringe lobe).
Current usage metrics show cumulative count of Article Views (full-text article views including HTML views, PDF and ePub downloads, according to the available data) and Abstracts Views on Vision4Press platform.
Data correspond to usage on the plateform after 2015. The current usage metrics is available 48-96 hours after online publication and is updated daily on week days.
Initial download of the metrics may take a while.