Fig. B.1
Download original image
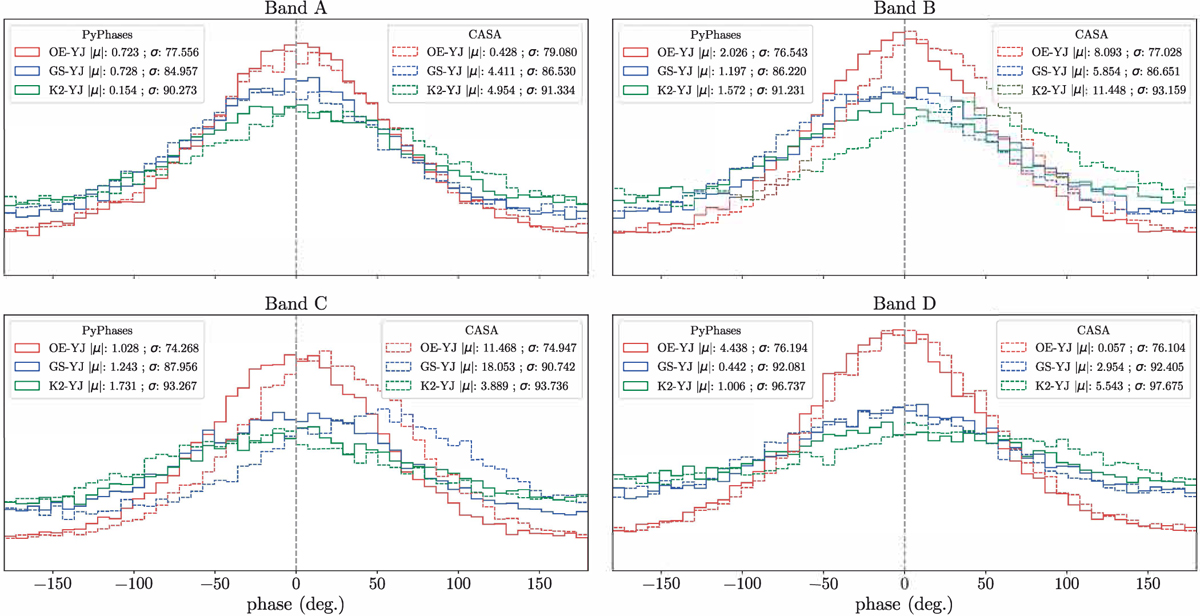
Phase histograms of the visibilities of scan 1362 (observed at 10:50 UT), of the source 0059+581, for a selection of baselines, after the Global Fringe Fitting calibration. Solid lines, using our WBGFF algorithm implemented in PyPhases; dotted lines, using the implementation in CASA (see text). In the boxes, we show the absolute value of the mean (|μ|) in deg. and the standard deviation (σ) in deg. for each distribution.
Current usage metrics show cumulative count of Article Views (full-text article views including HTML views, PDF and ePub downloads, according to the available data) and Abstracts Views on Vision4Press platform.
Data correspond to usage on the plateform after 2015. The current usage metrics is available 48-96 hours after online publication and is updated daily on week days.
Initial download of the metrics may take a while.