Open Access
Fig. 11
Download original image
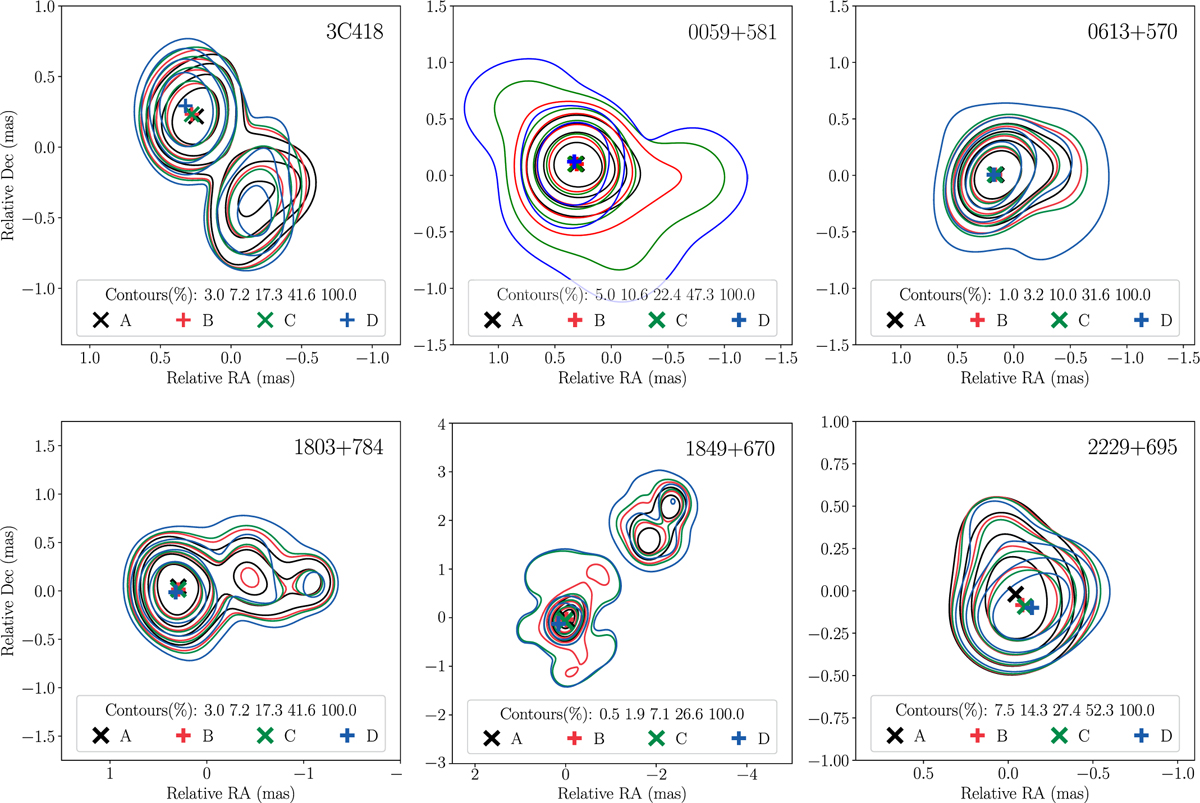
Total intensity maps from VGOS experiment VO2187 obtained from the multifrequency image and the spectral index map. The contours are shown at five levels of the peak percentage, specified in the legend of the plots. Each contour color represents the map for the central frequency of each band: 3.25, 5.5, 6.75, and 10.5 GHz.
Current usage metrics show cumulative count of Article Views (full-text article views including HTML views, PDF and ePub downloads, according to the available data) and Abstracts Views on Vision4Press platform.
Data correspond to usage on the plateform after 2015. The current usage metrics is available 48-96 hours after online publication and is updated daily on week days.
Initial download of the metrics may take a while.