Open Access
Fig. 10
Download original image
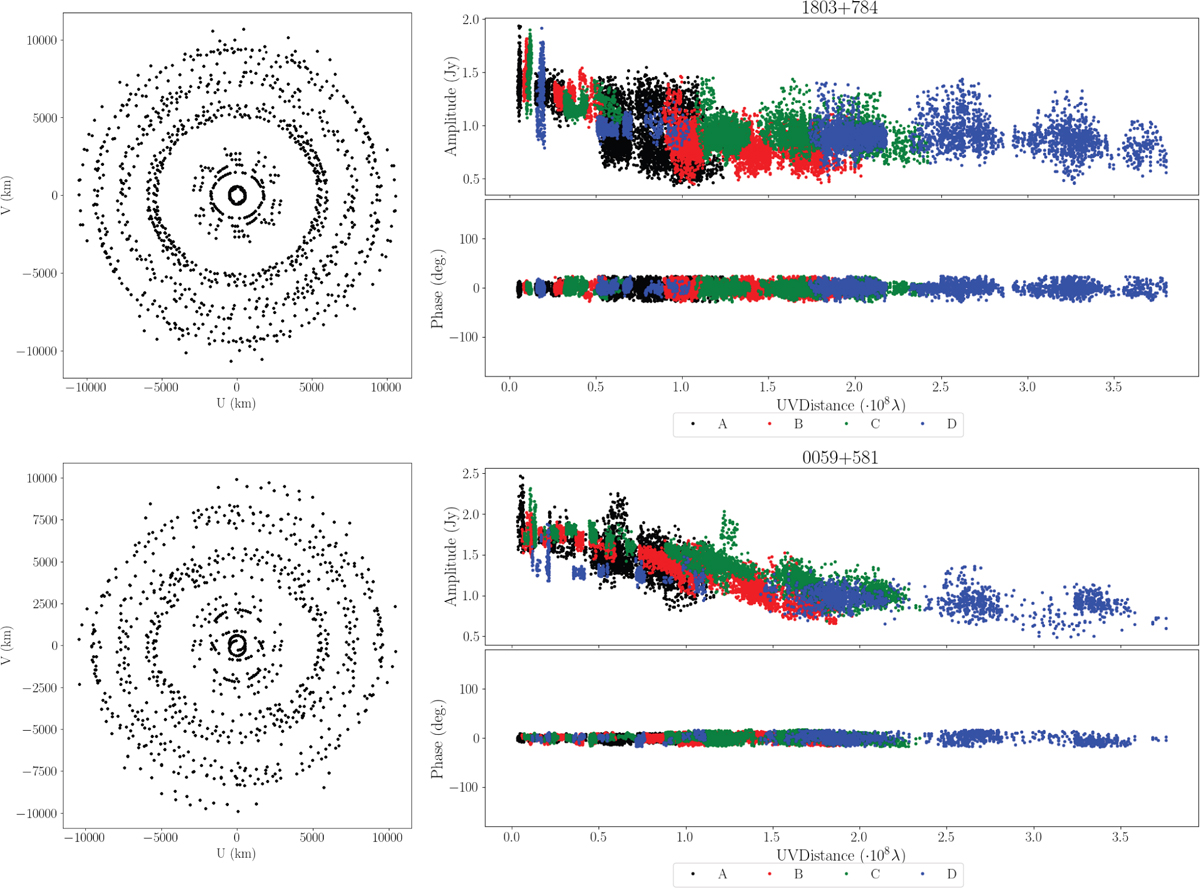
UV-coverage plots for sources 1803+784 (left, top) and 0059+581 (left, bottom). Amplitudes and phases of the RR and LL visibilities as a function of distance in Fourier space (right) in units of wavelength. The different VGOS bands are shown in different colors.
Current usage metrics show cumulative count of Article Views (full-text article views including HTML views, PDF and ePub downloads, according to the available data) and Abstracts Views on Vision4Press platform.
Data correspond to usage on the plateform after 2015. The current usage metrics is available 48-96 hours after online publication and is updated daily on week days.
Initial download of the metrics may take a while.