Open Access
Fig. E.1
Download original image
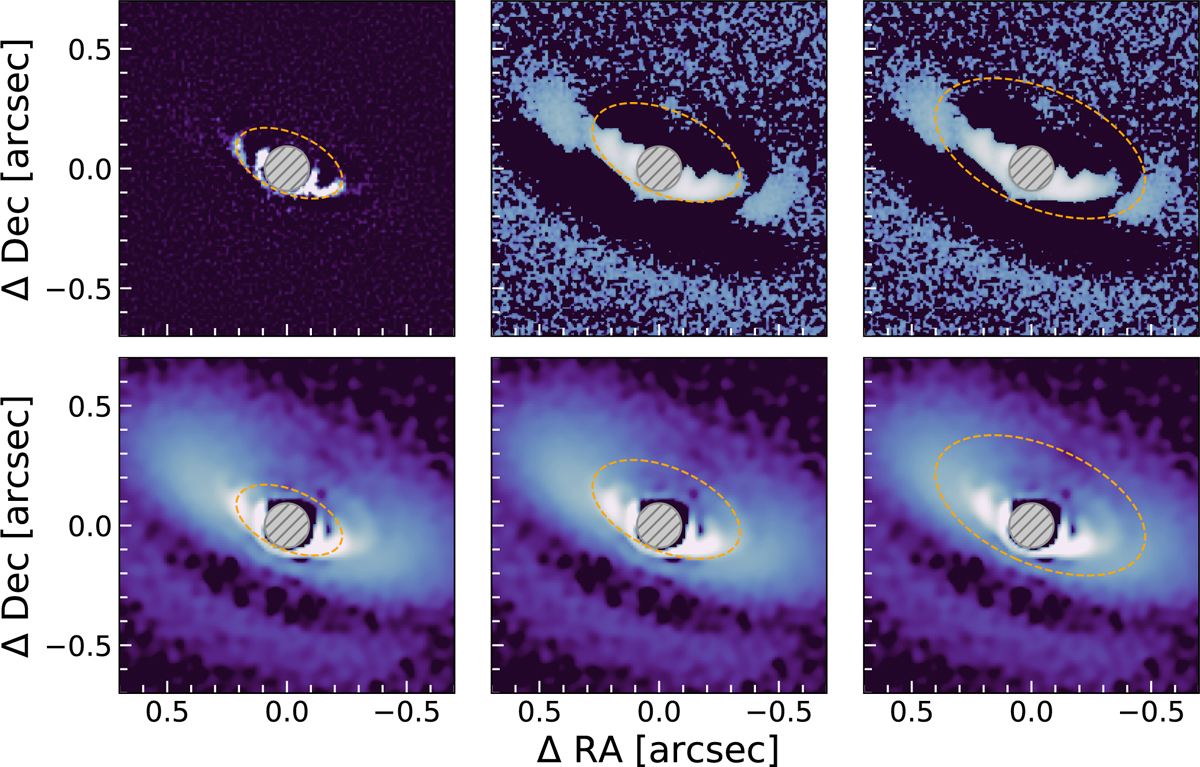
SPHERE scattered light data after high pass filtering (top row) and deconvolution (bottom row). The color map was adjusted in each panel to highlight the most prominent sub-structure in the disk. We overplot ellipses tracing the two inner rings and the following gap from left to right.
Current usage metrics show cumulative count of Article Views (full-text article views including HTML views, PDF and ePub downloads, according to the available data) and Abstracts Views on Vision4Press platform.
Data correspond to usage on the plateform after 2015. The current usage metrics is available 48-96 hours after online publication and is updated daily on week days.
Initial download of the metrics may take a while.