Open Access
Fig. 3
Download original image
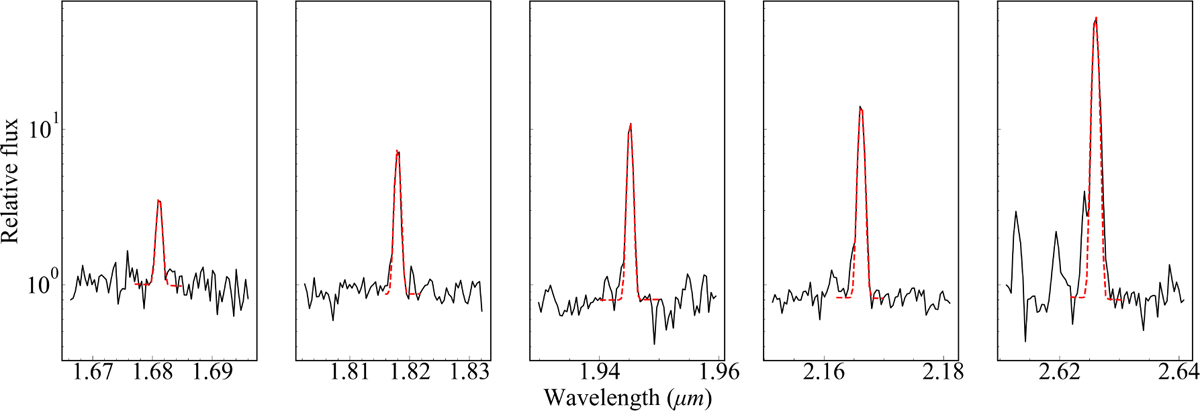
Five Brackett series line profiles are shown from a representative spectrum, plotted in log-scale. The best fitting Gaussian profile is shown as a red dashed line.
Current usage metrics show cumulative count of Article Views (full-text article views including HTML views, PDF and ePub downloads, according to the available data) and Abstracts Views on Vision4Press platform.
Data correspond to usage on the plateform after 2015. The current usage metrics is available 48-96 hours after online publication and is updated daily on week days.
Initial download of the metrics may take a while.