Fig. 5
Download original image
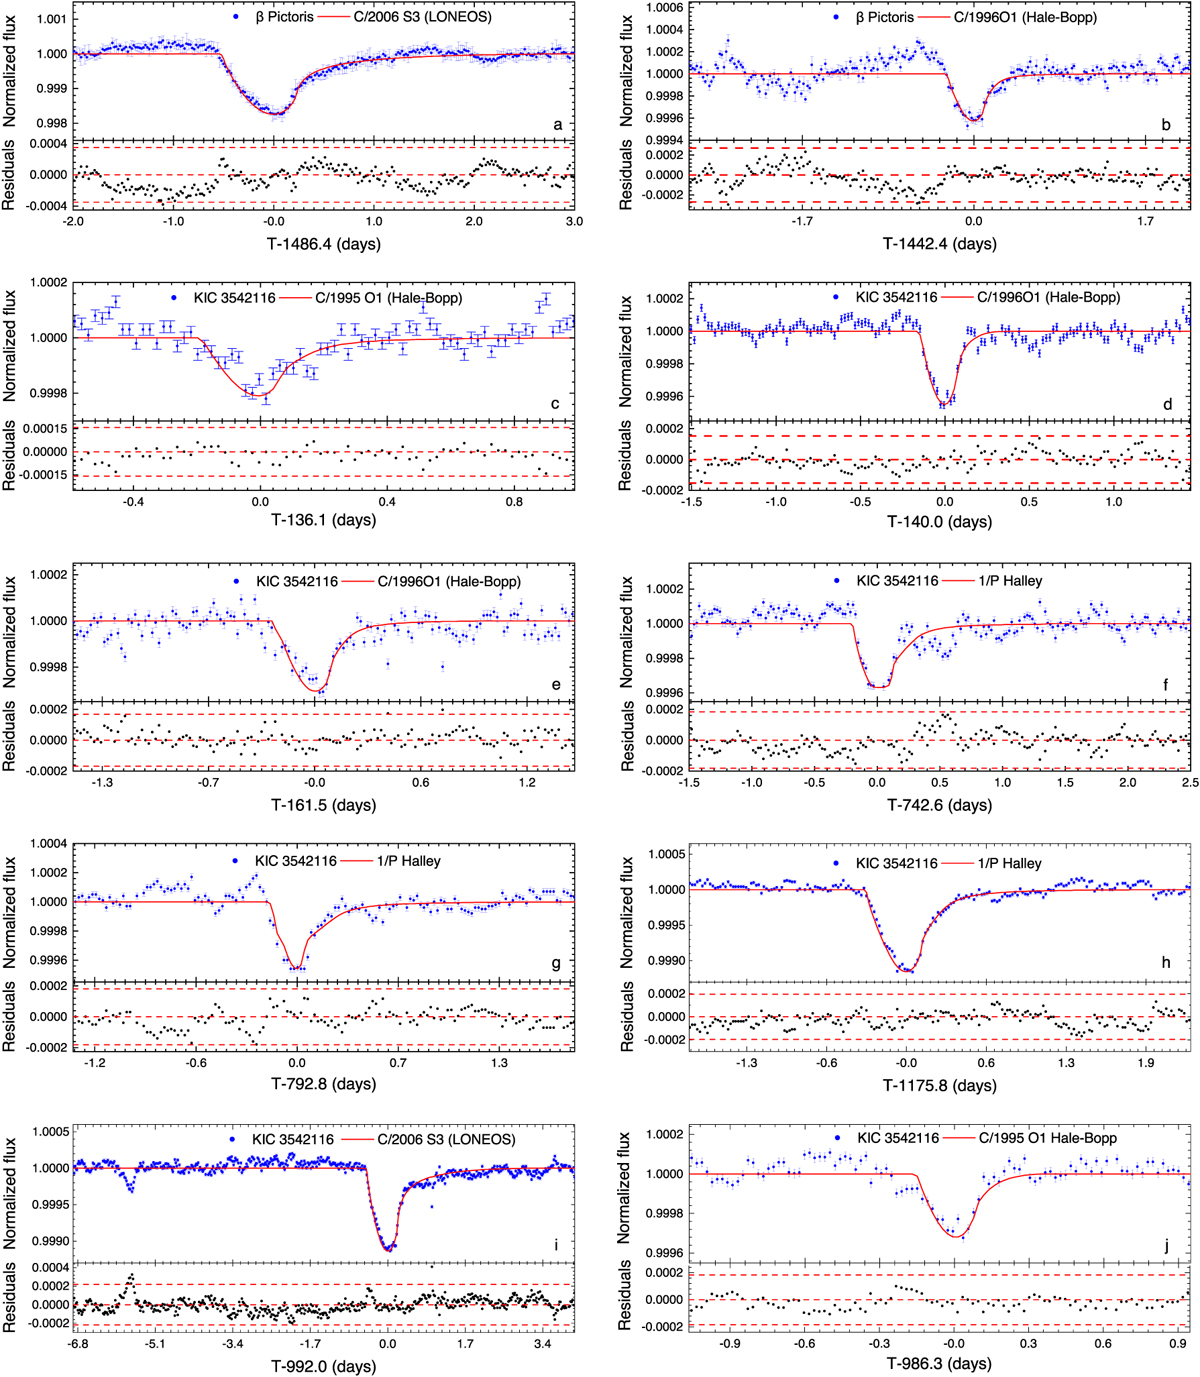
Segments of the β Pic and KIC 3542116 light curves around the observed transit events along with the best fitted model profiles: a – β Pic(sector 6) and comet C/2006 S3 (LONEOS) at r = 5.5au; b – β Pic(sector 5) and comet C/1995 O1 (Hale–Bopp) at r =1.0au; c − KIC 3542116 (sector 1) and comet C/1995 O1 (Hale–Bopp) at r = 1.0 au; d − KIC 3542116 (sector 1) and comet C/1995 O1 (Hale–Bopp) at r = 1.0 au; e − KIC 3542116 (sector 1) and comet C/1995 O1 (Hale–Bopp) at r =1.0 au; f − KIC 3542116 (sector 8) and comet 1P Halley at r = 0.6au; g − KIC 3542116 (sector 8) and comet 1P Halley at r = 0.6 au; h − KIC 3542116 (sector 12) and comet 1P Halley at r = 0.6 au; i − KIC 3542116 (sector 10) and comet C/2006 S3 (LONEOS) at r = 5.5 au; j − KIC 3542116 (sector 10) and comet C/1995 O1 (Hale–Bopp) at r =1.0 au. Upper panels: blue points display the 30 min binned β Pic normalized flux (a and b) and the normalized flux of KIC 3542116 (d–j). The red line shows the best-fit model, obtained with the 2D simulation images of respective comets (see Table 3). Lower panels: residuals from the fit. The dashed red lines indicate the 3σ limit.
Current usage metrics show cumulative count of Article Views (full-text article views including HTML views, PDF and ePub downloads, according to the available data) and Abstracts Views on Vision4Press platform.
Data correspond to usage on the plateform after 2015. The current usage metrics is available 48-96 hours after online publication and is updated daily on week days.
Initial download of the metrics may take a while.