Fig. 9.
Download original image
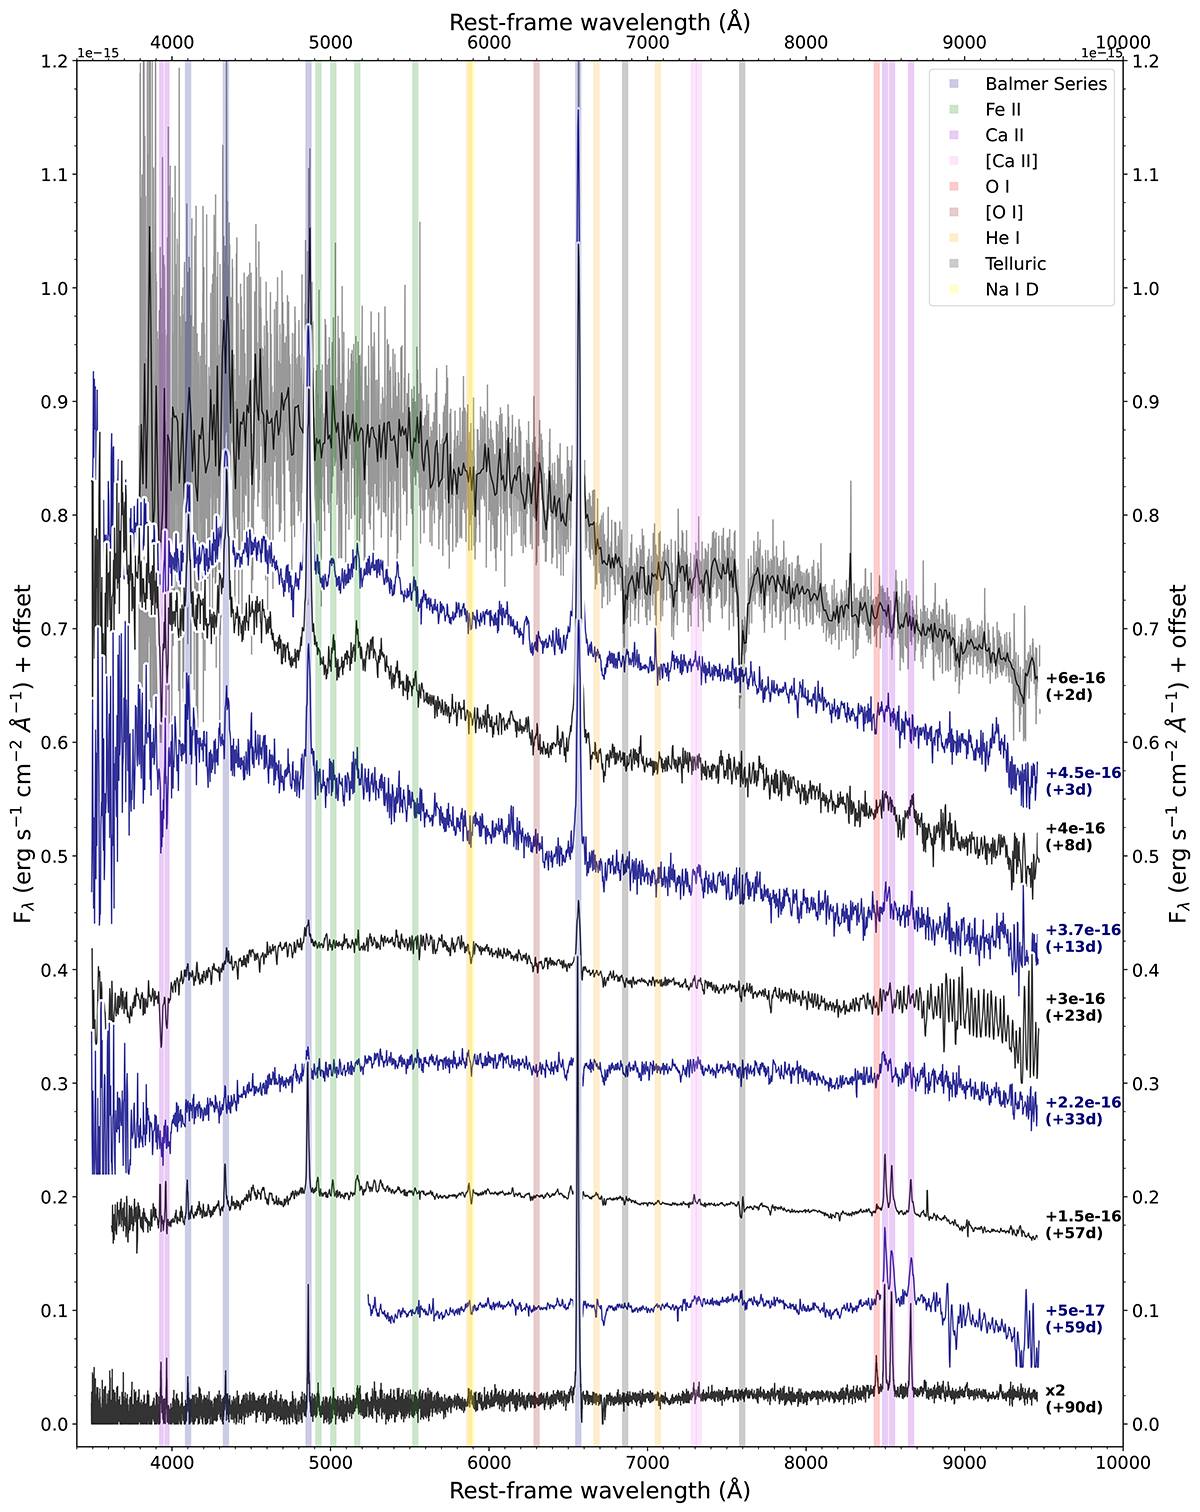
Optical spectral sequence of AT 2022fnm. The spectra have been calibrated against the photometry. The offsets applied to each spectrum are shown in the plot, and the +90 d spectrum has been multiplied by a factor of 2 for clarity. Negative fluxes have been set to zero. The +2 d spectrum is plotted in grey with a version binned to 10 Å overplotted in black to compensate for the noise of the spectrum. The absorption features seen at approximately 6725 Å and 8200 Å are artefacts.
Current usage metrics show cumulative count of Article Views (full-text article views including HTML views, PDF and ePub downloads, according to the available data) and Abstracts Views on Vision4Press platform.
Data correspond to usage on the plateform after 2015. The current usage metrics is available 48-96 hours after online publication and is updated daily on week days.
Initial download of the metrics may take a while.